ASEC-ATUS Balance
Year 2023
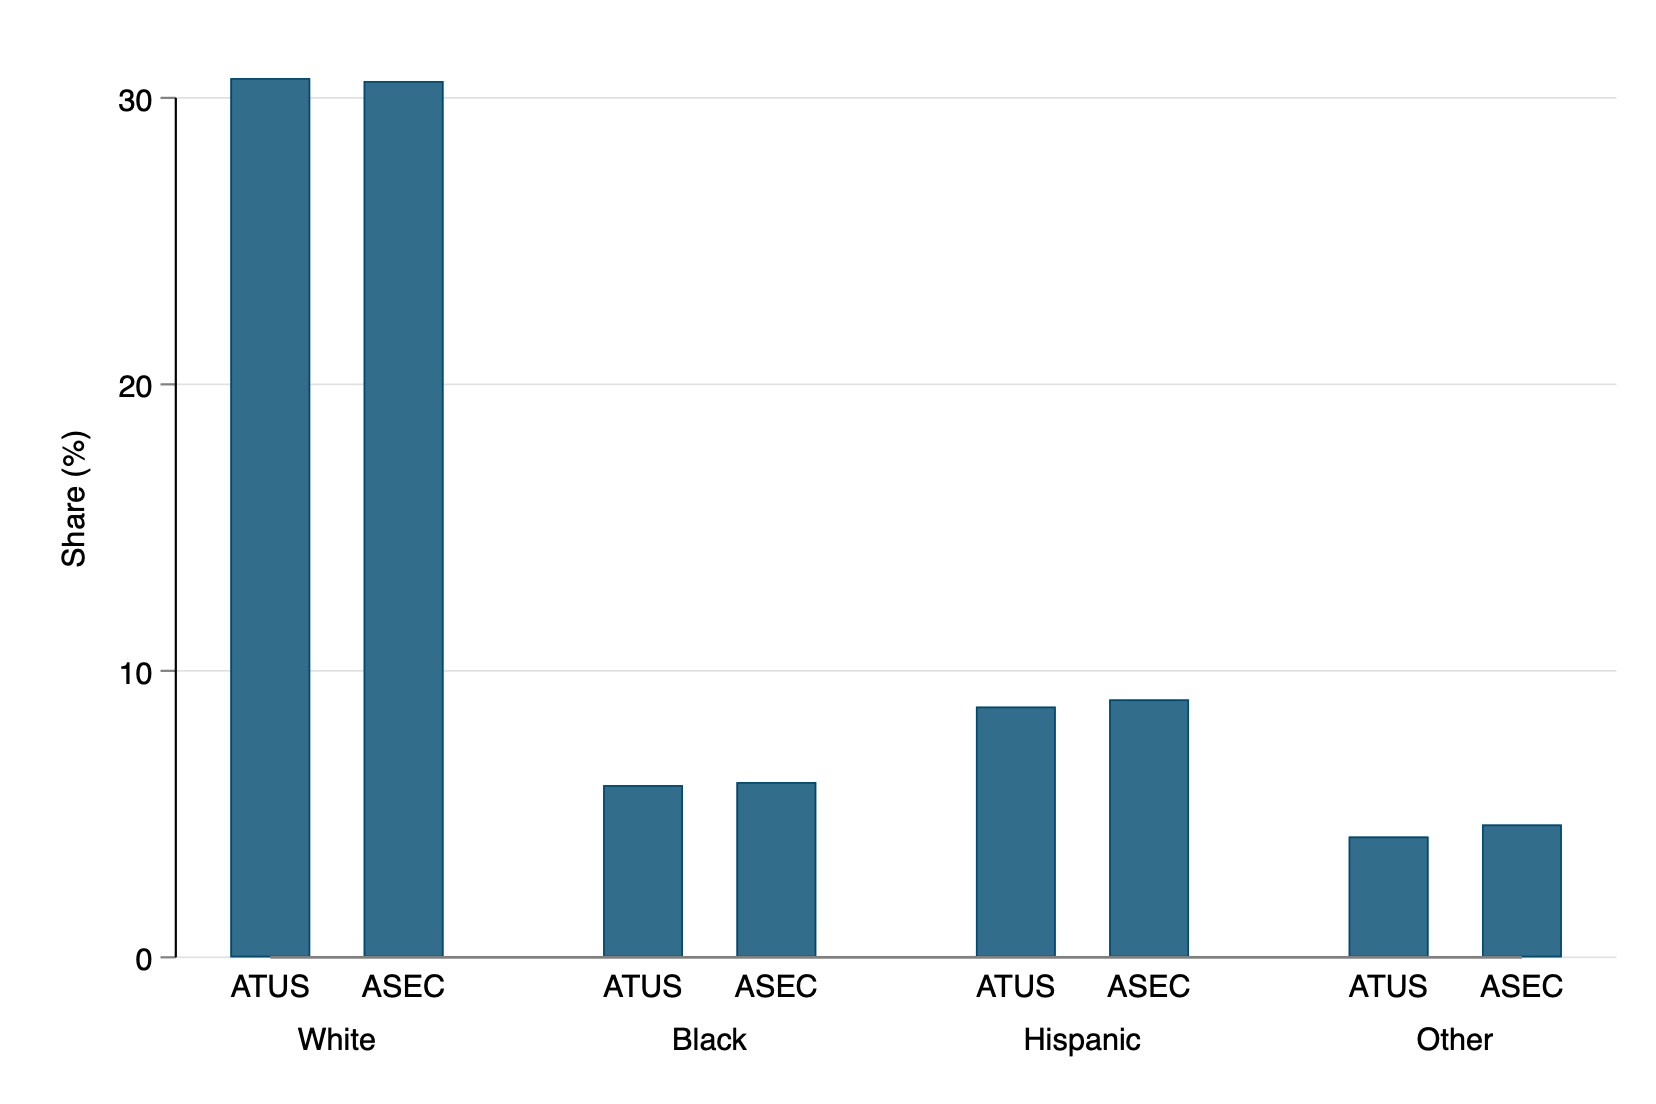
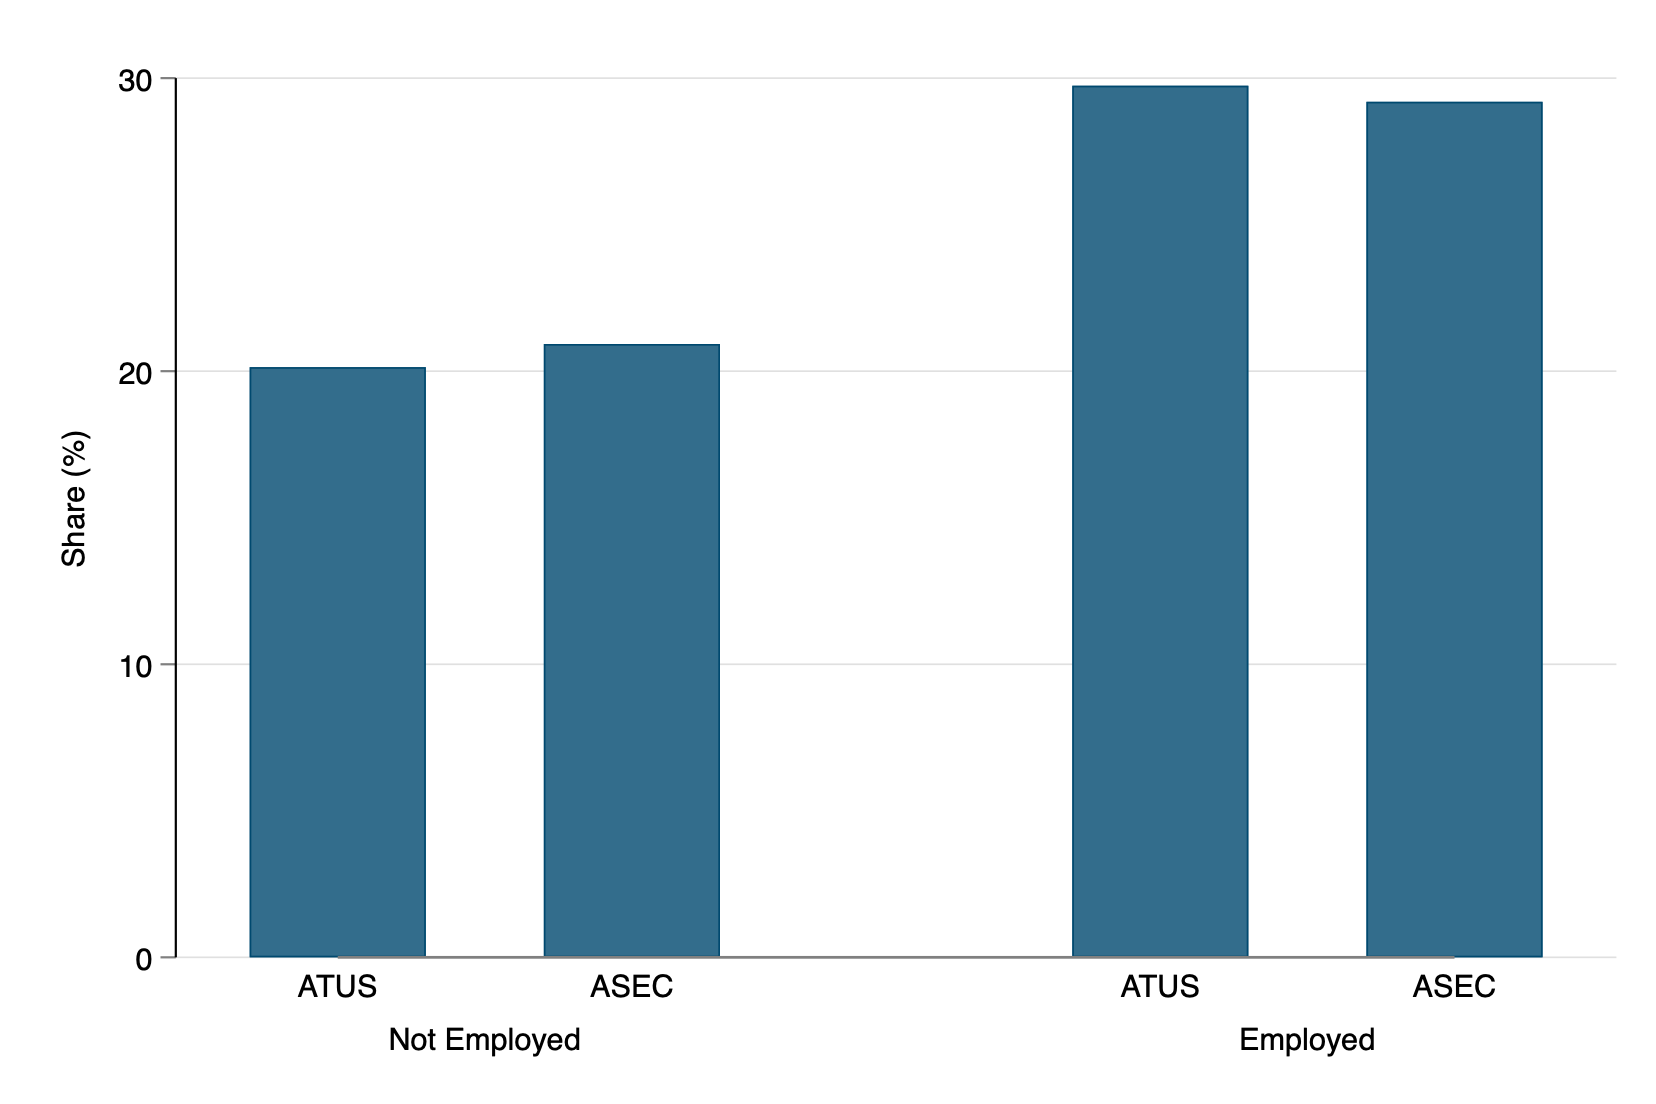
This page contains bar charts presenting the balance quality of data between ATUS (weekday and weekend) and ASEC.
This is done for main selected variables
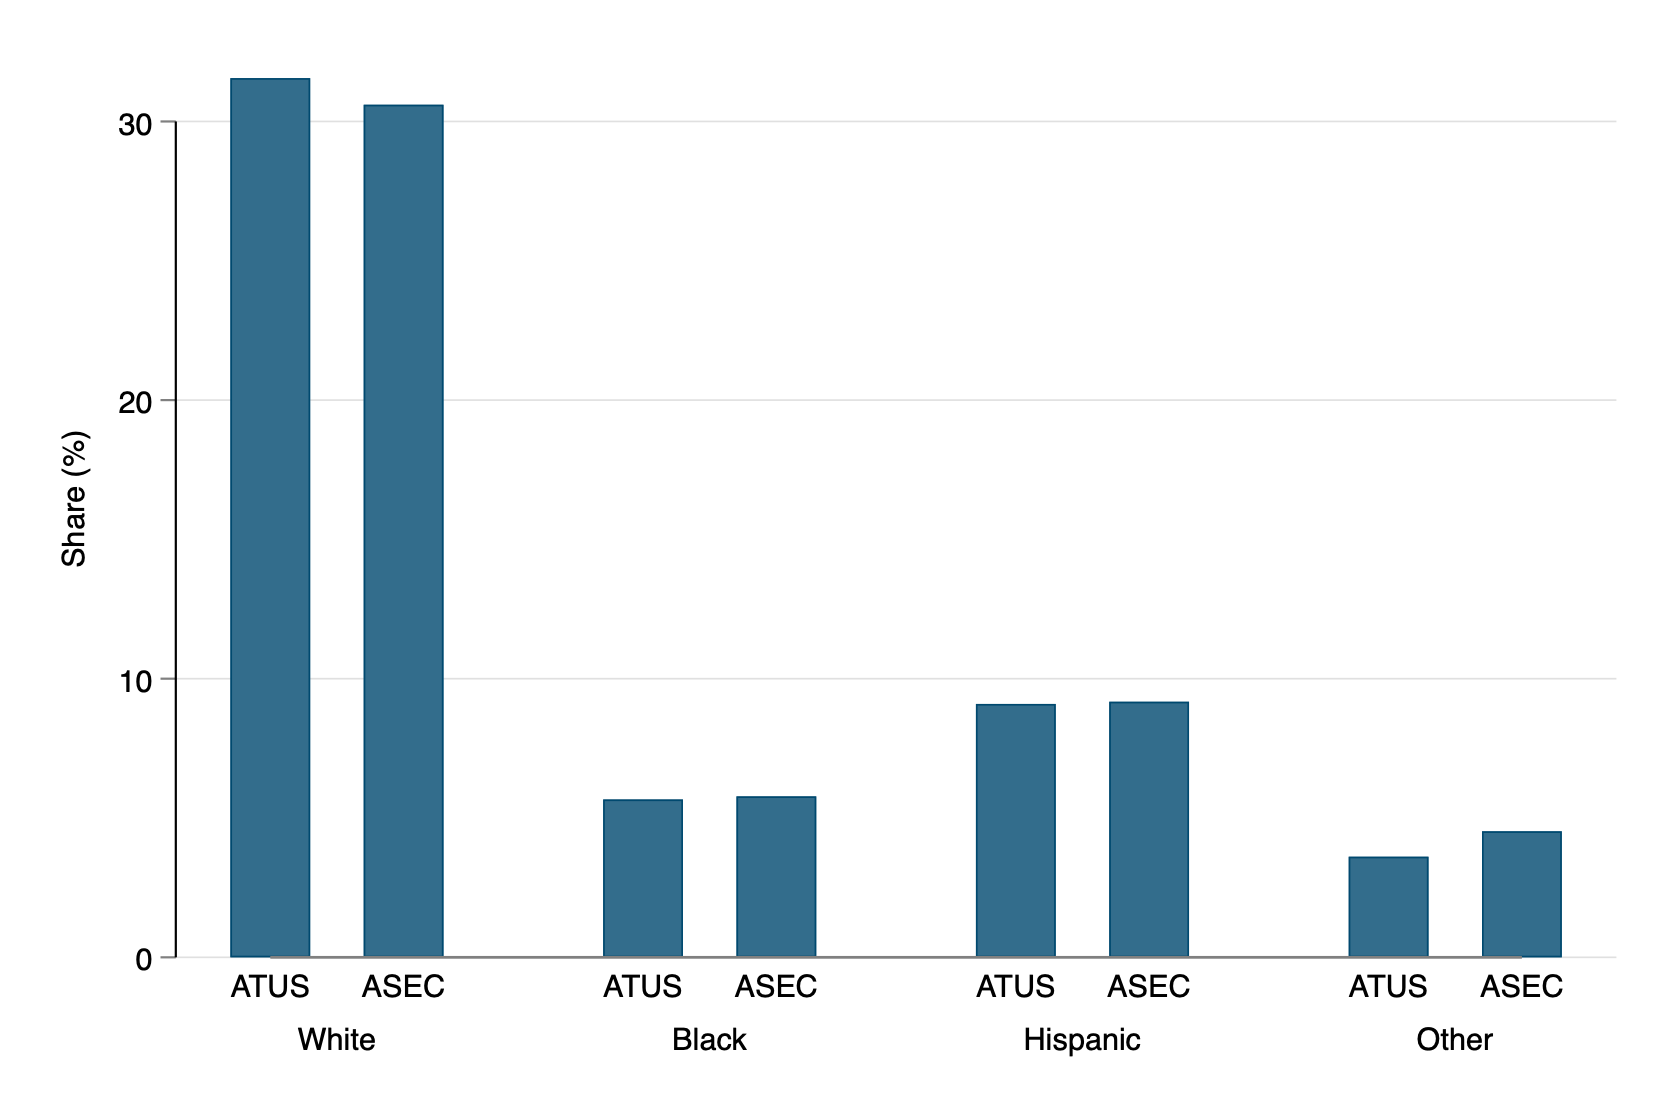
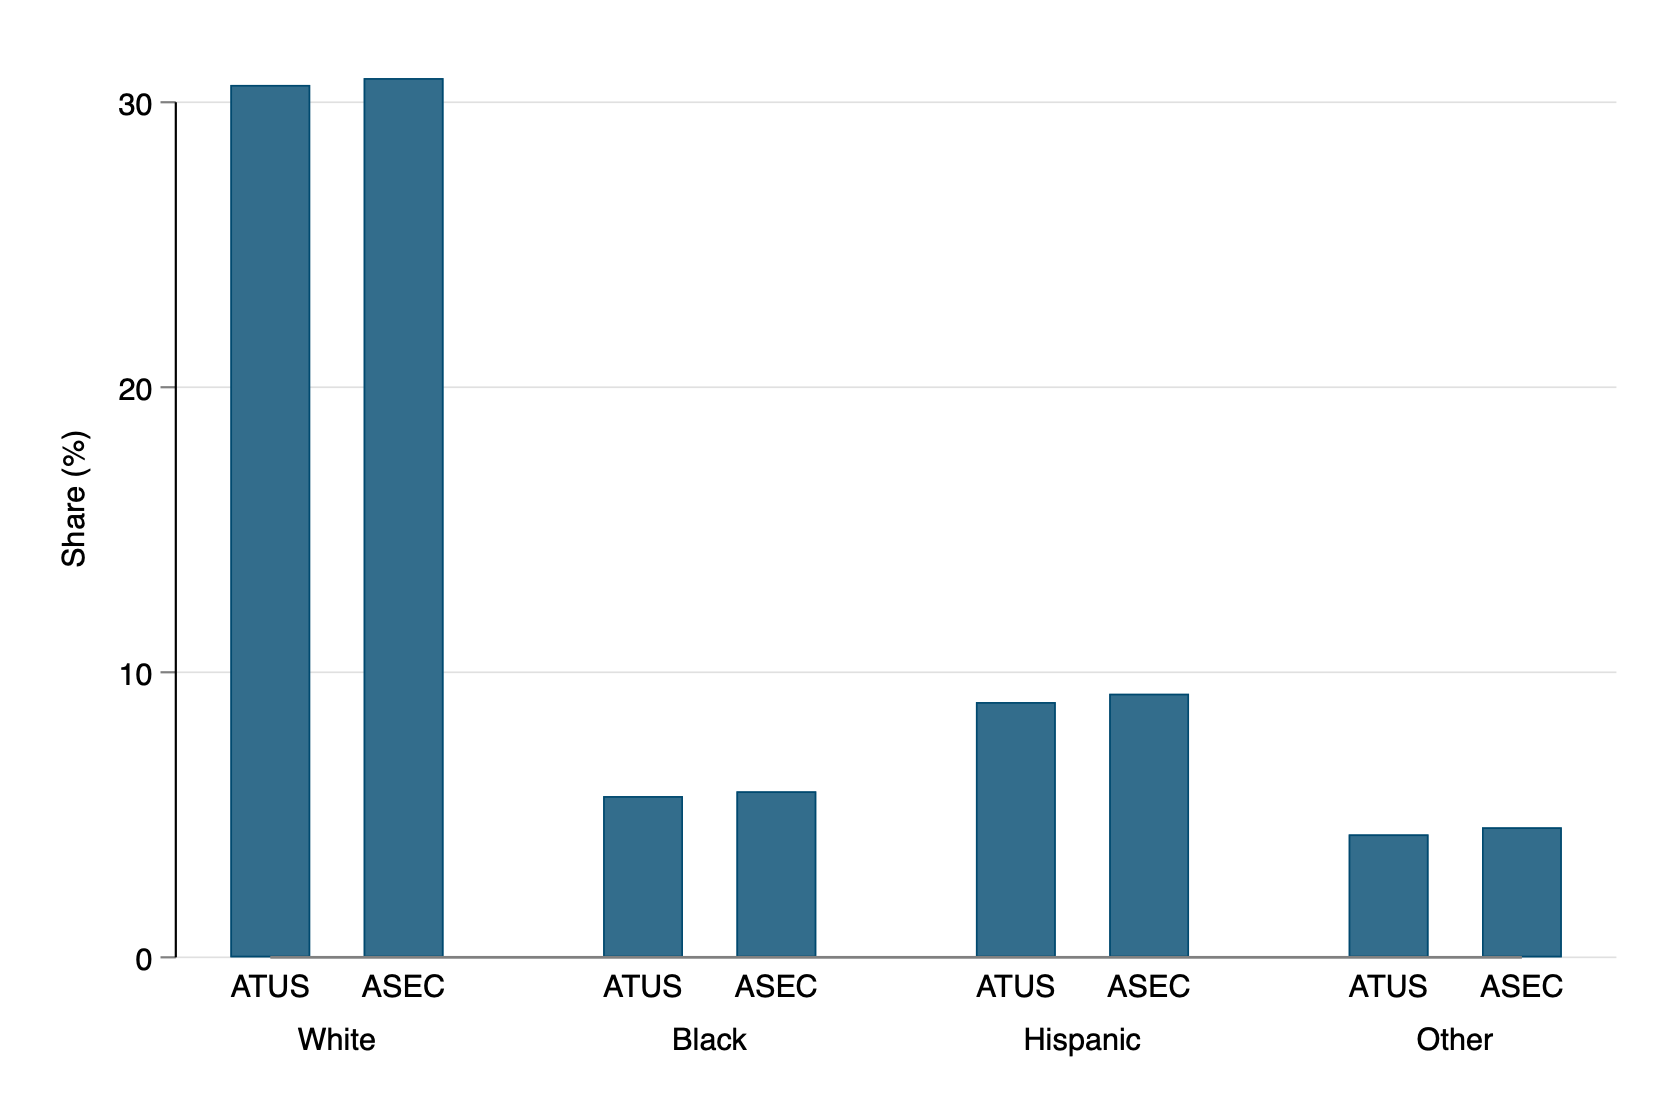
Race
Weekend

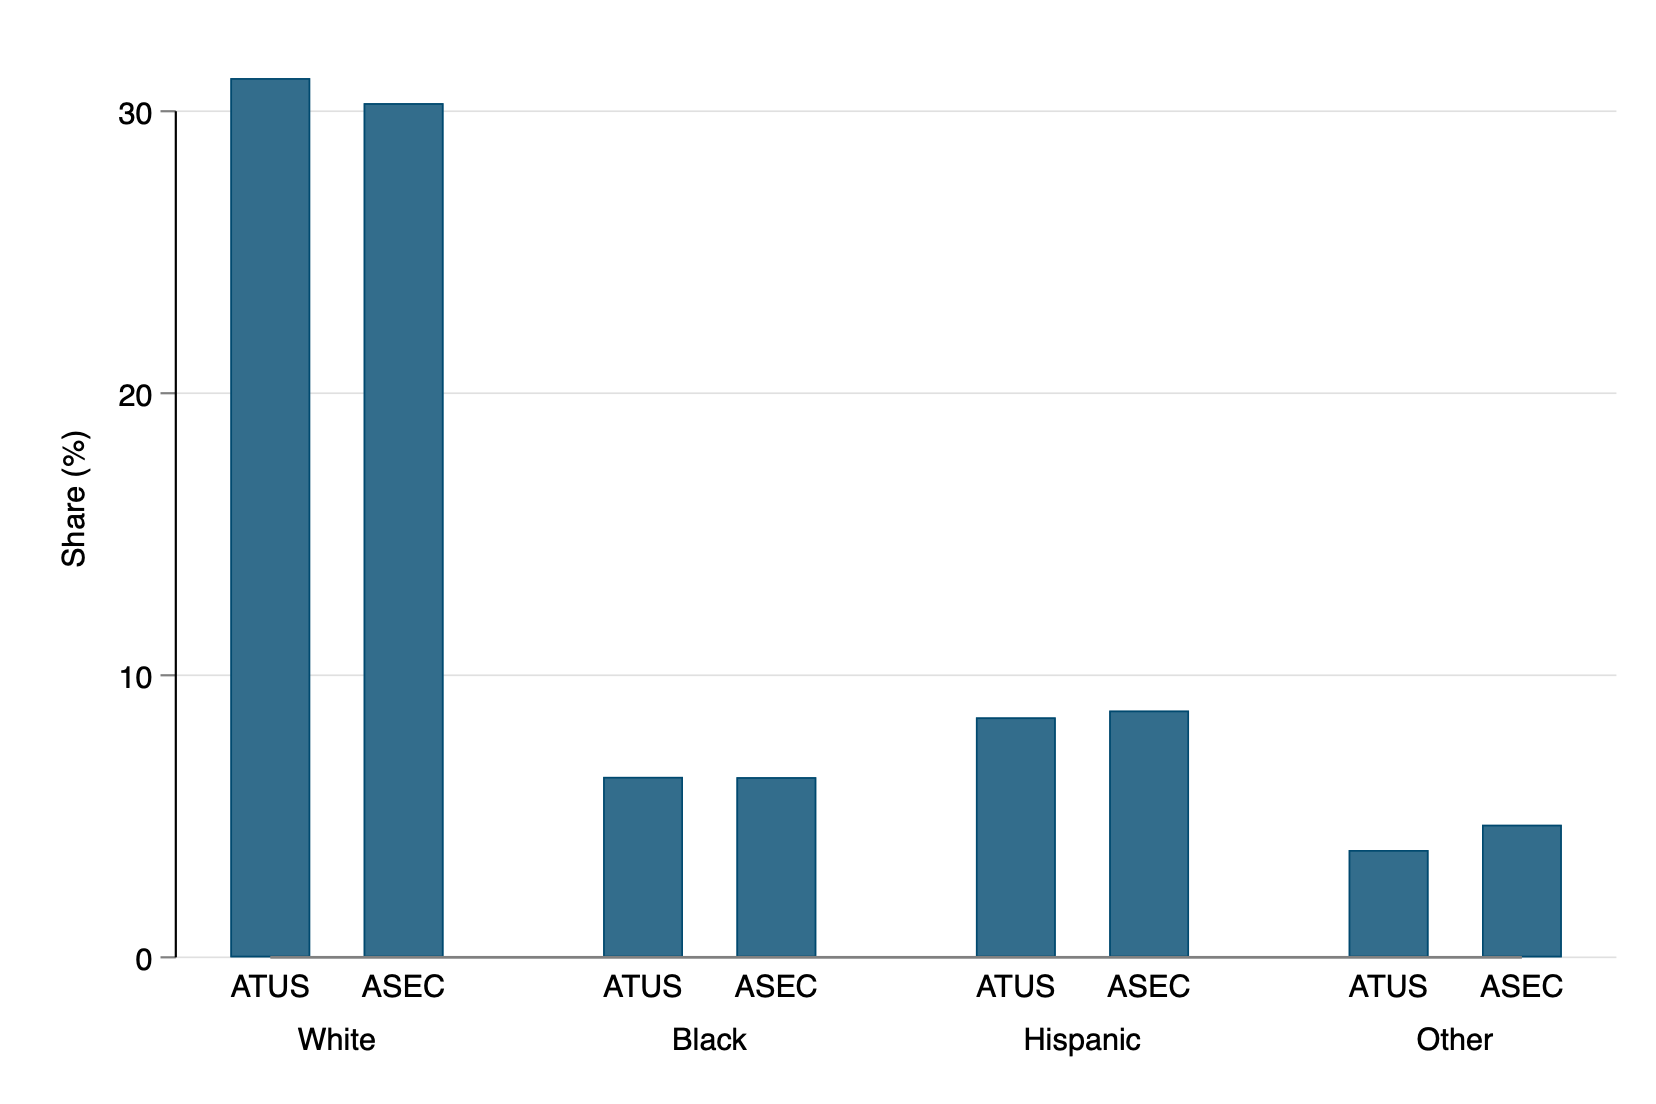
Weekday

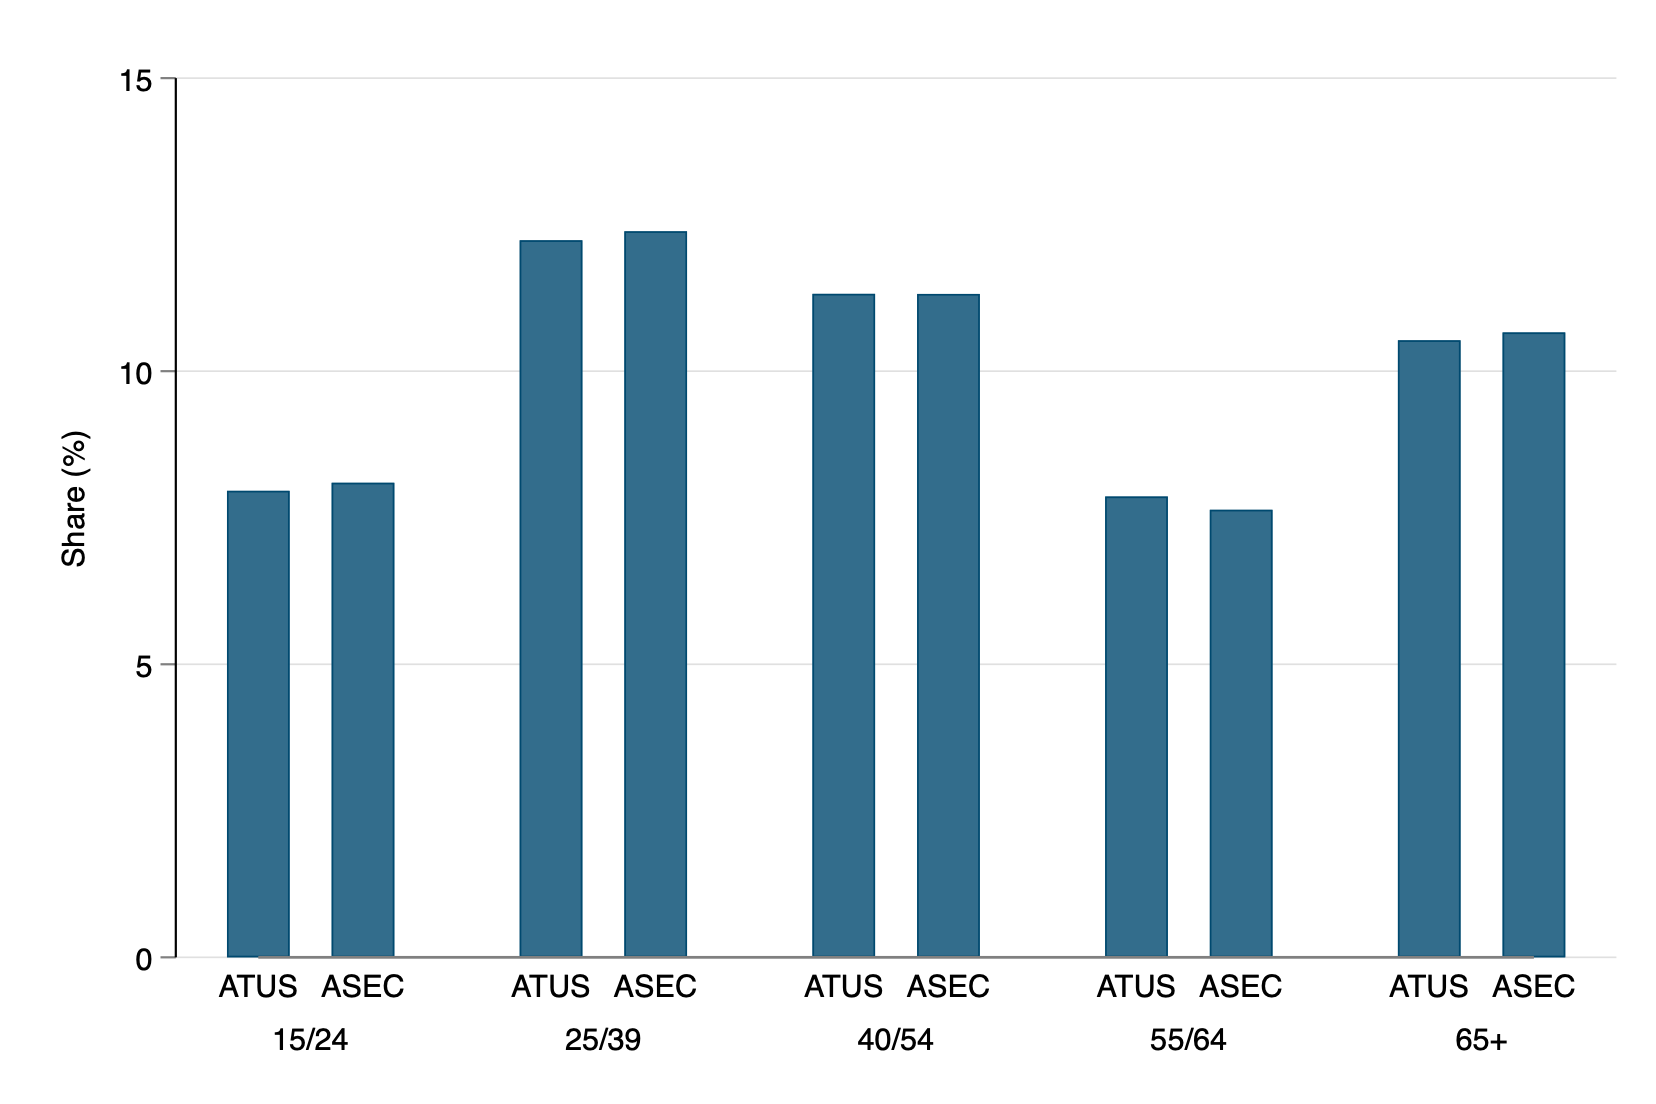
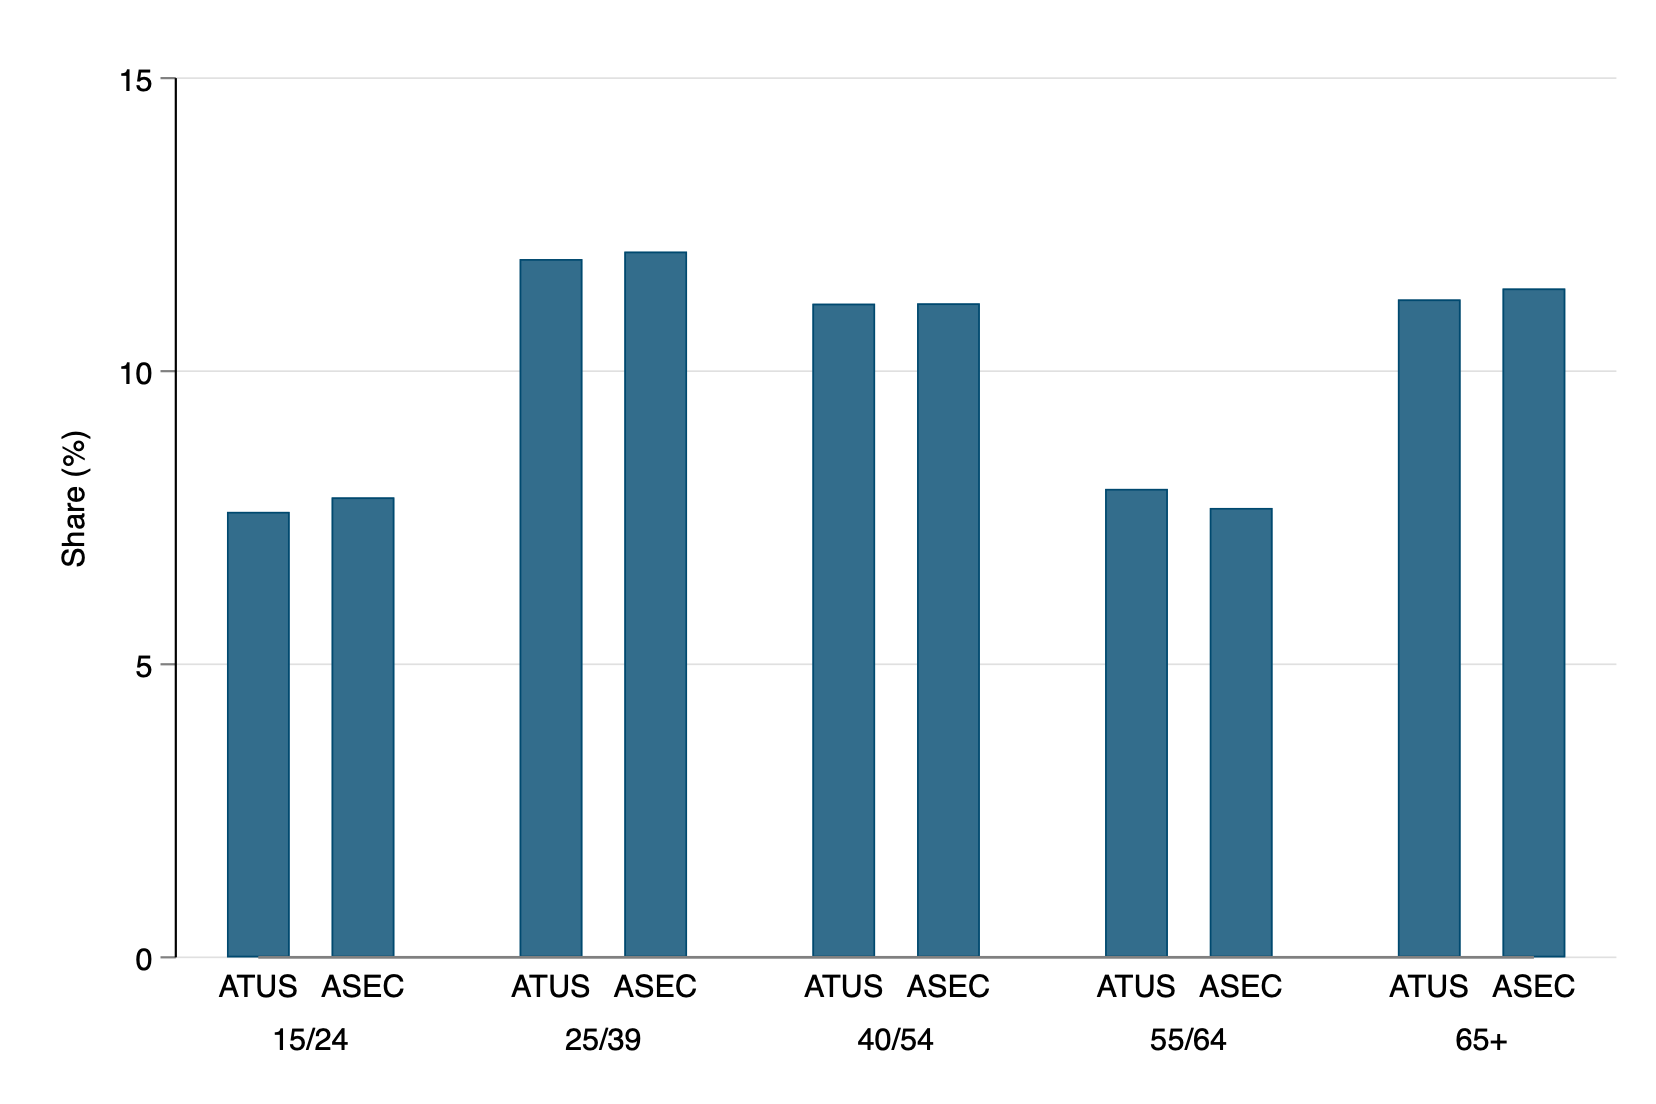
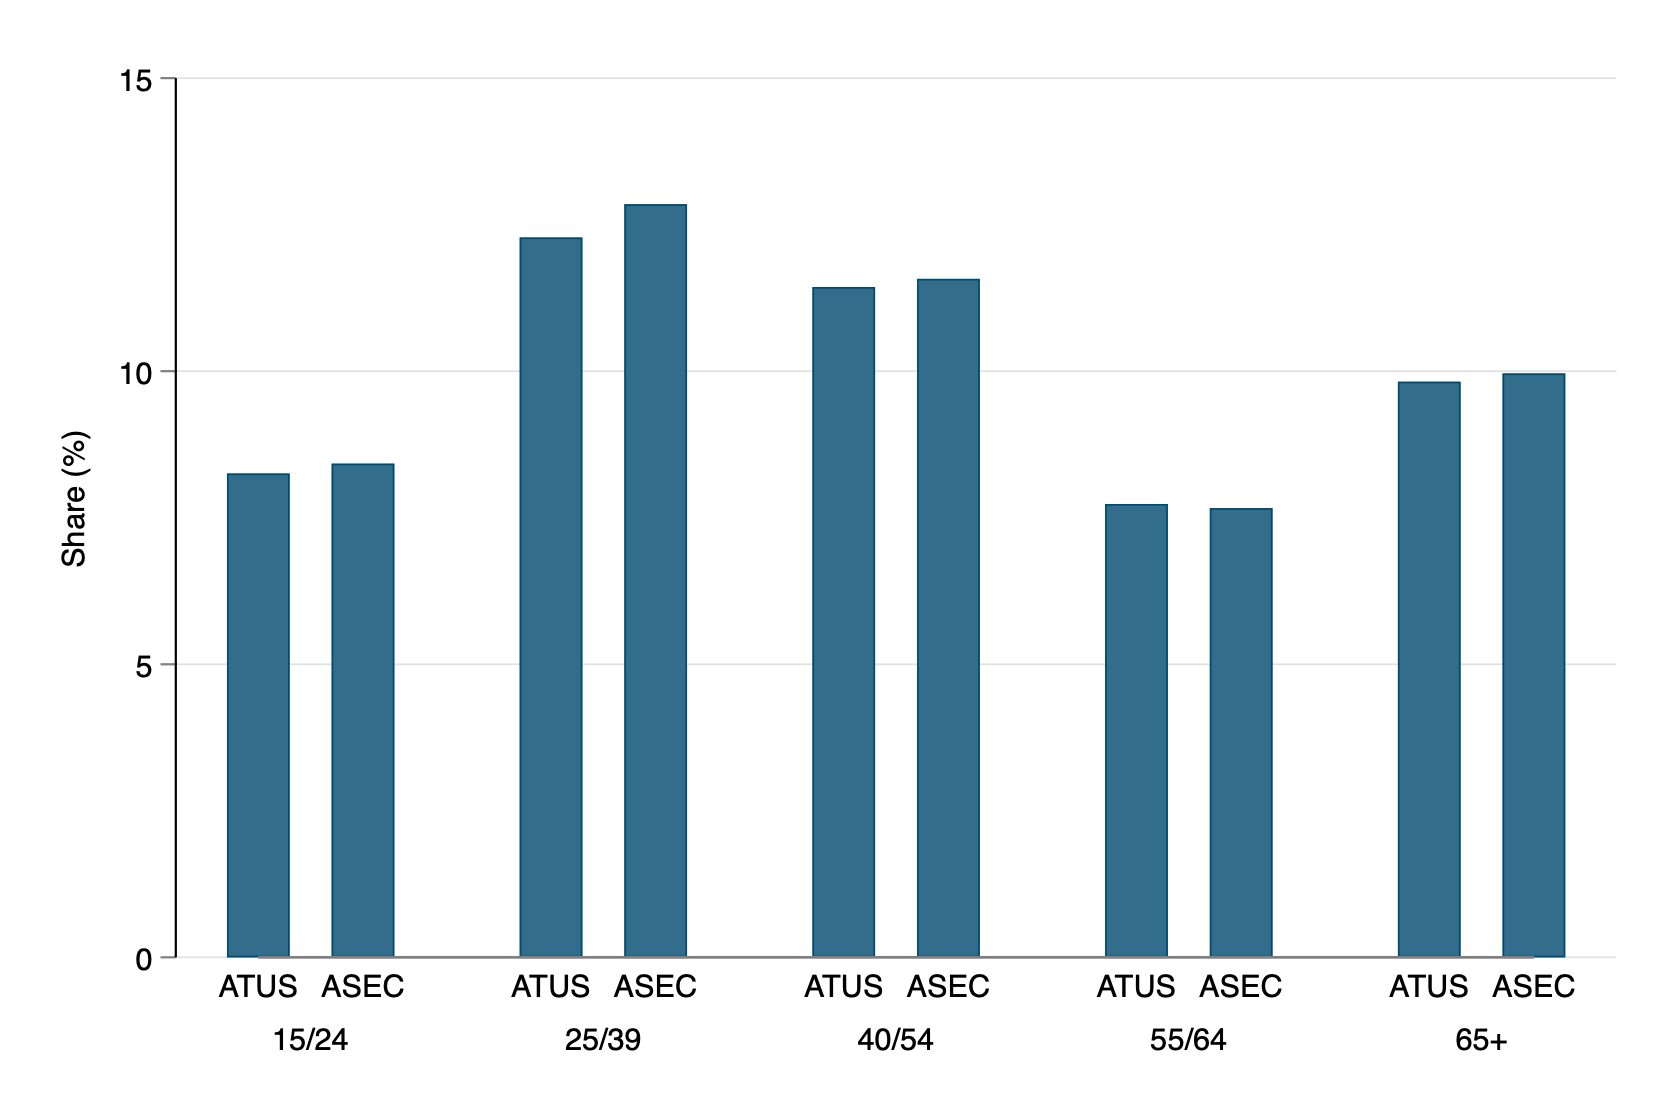
Age Group
Weekend
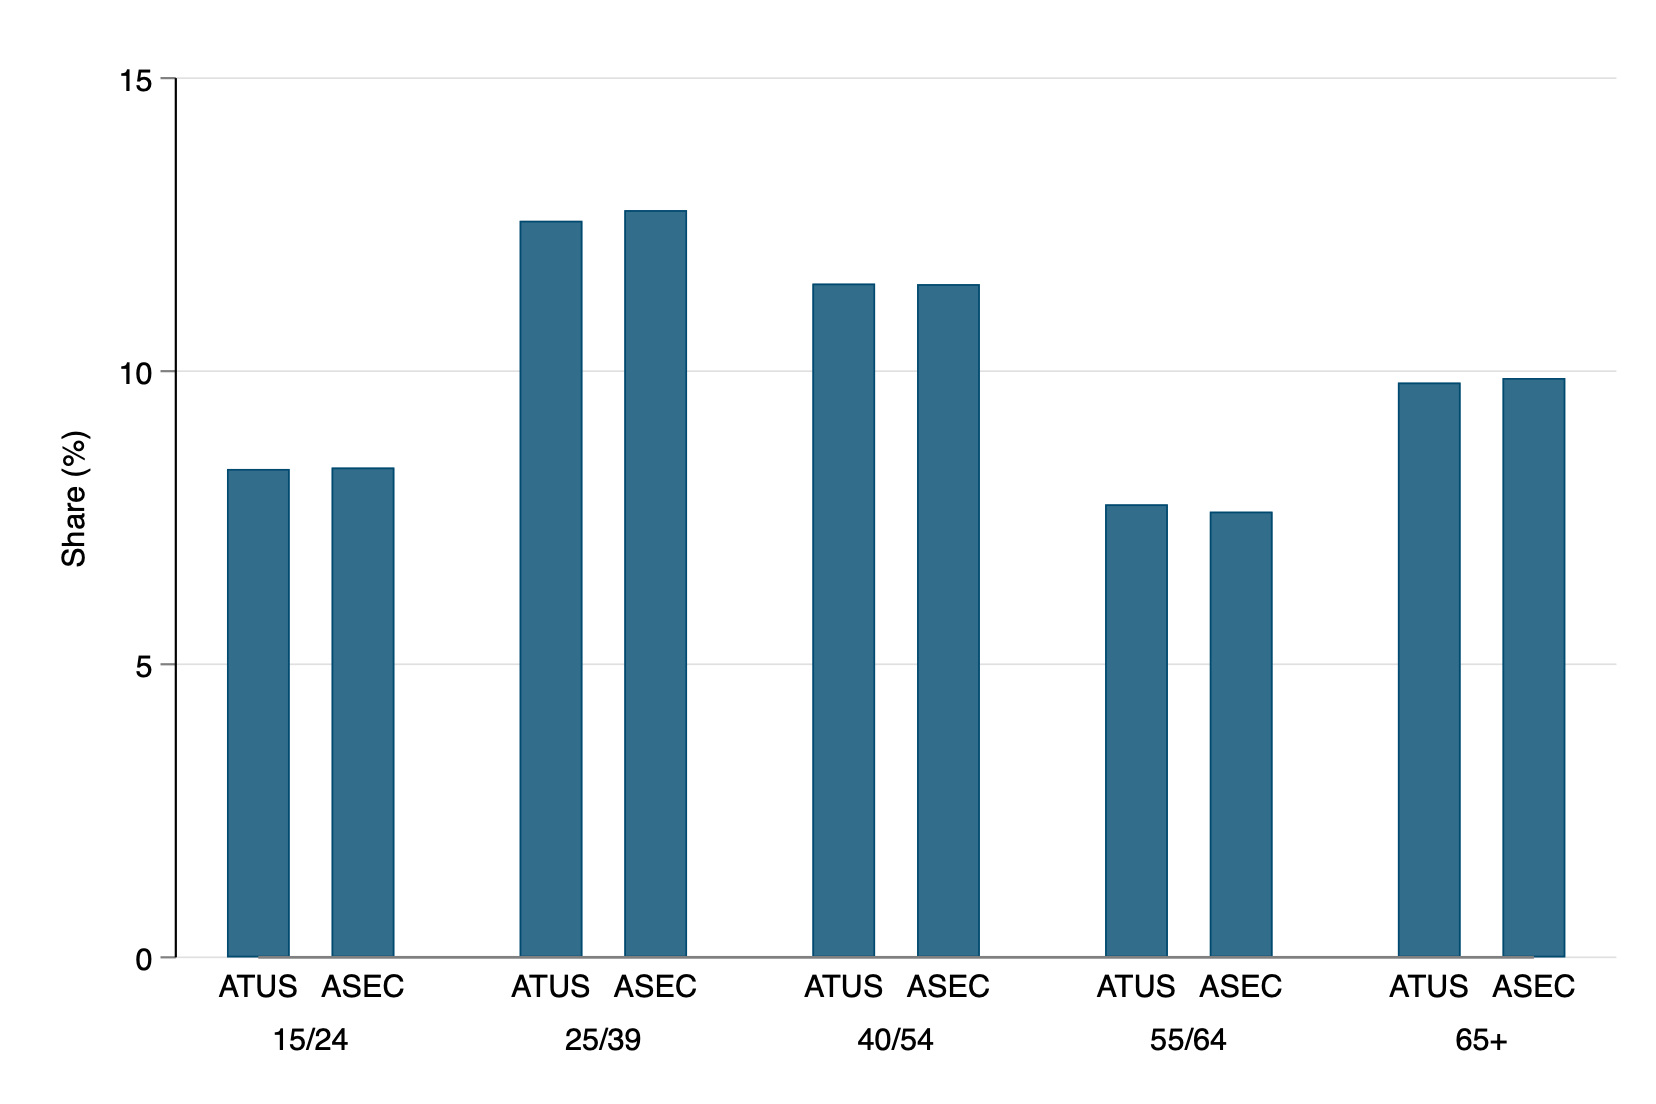
Weekday


Weekend
Weekday

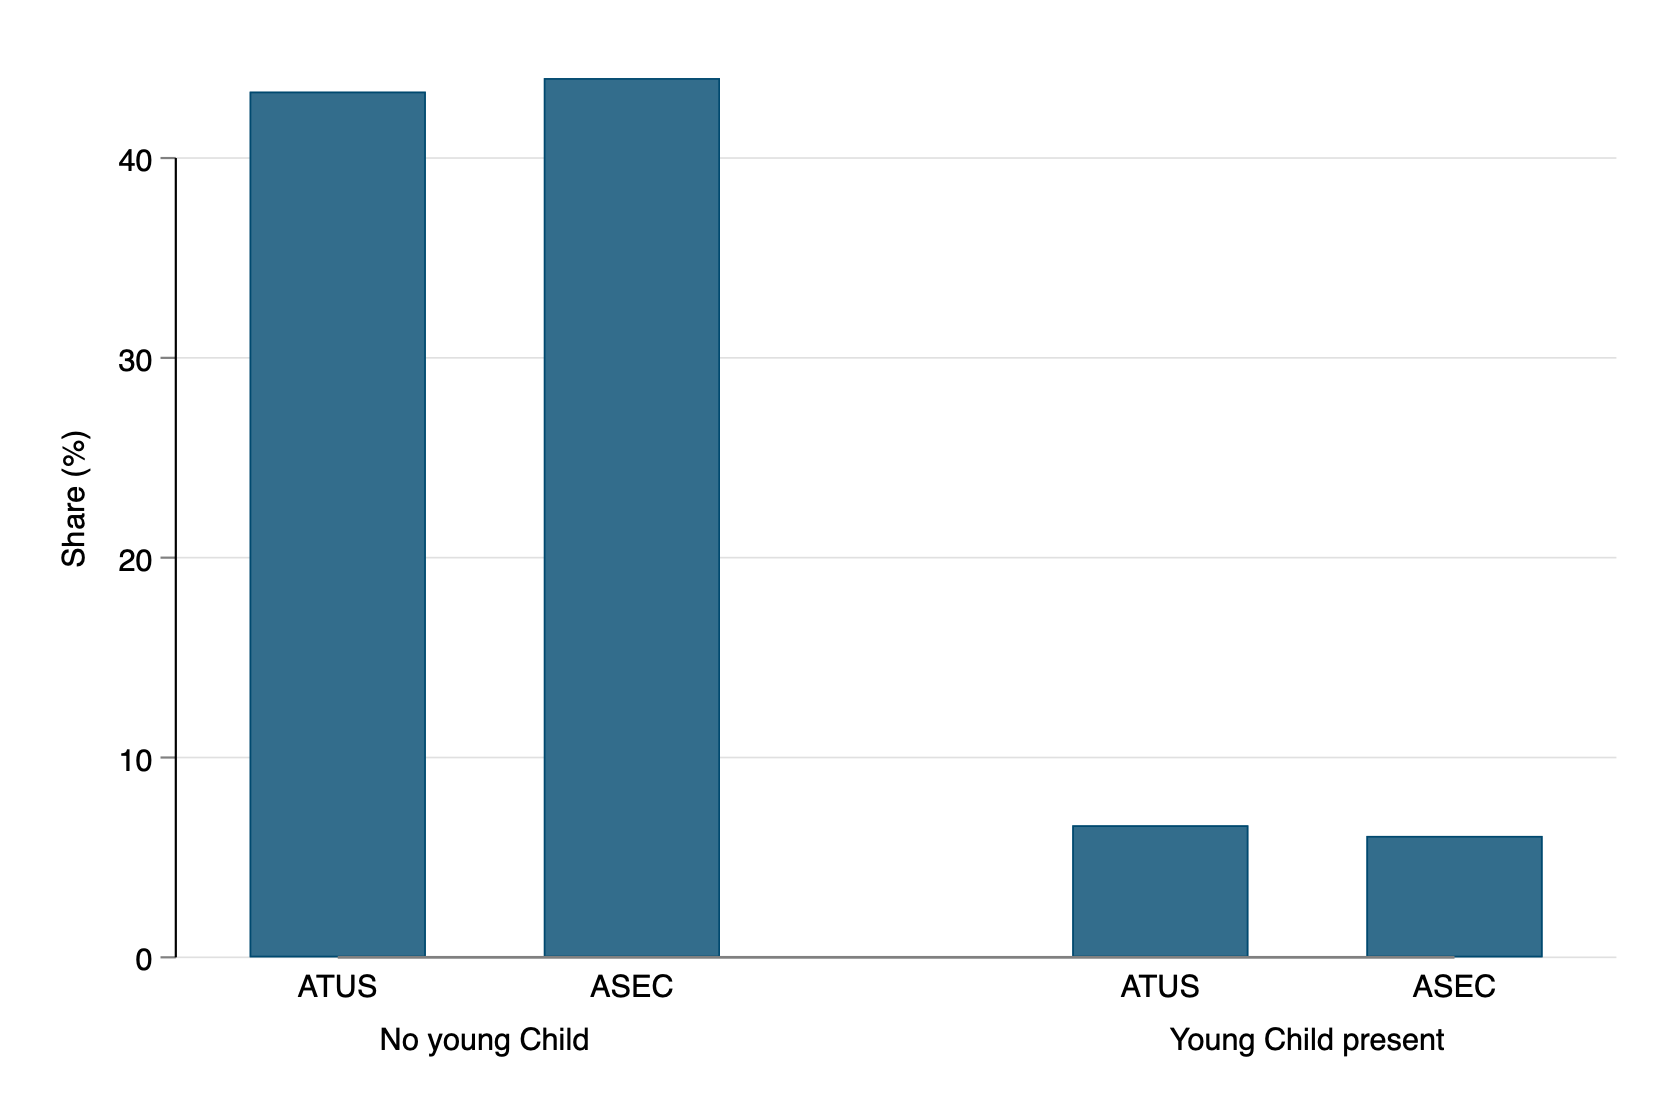
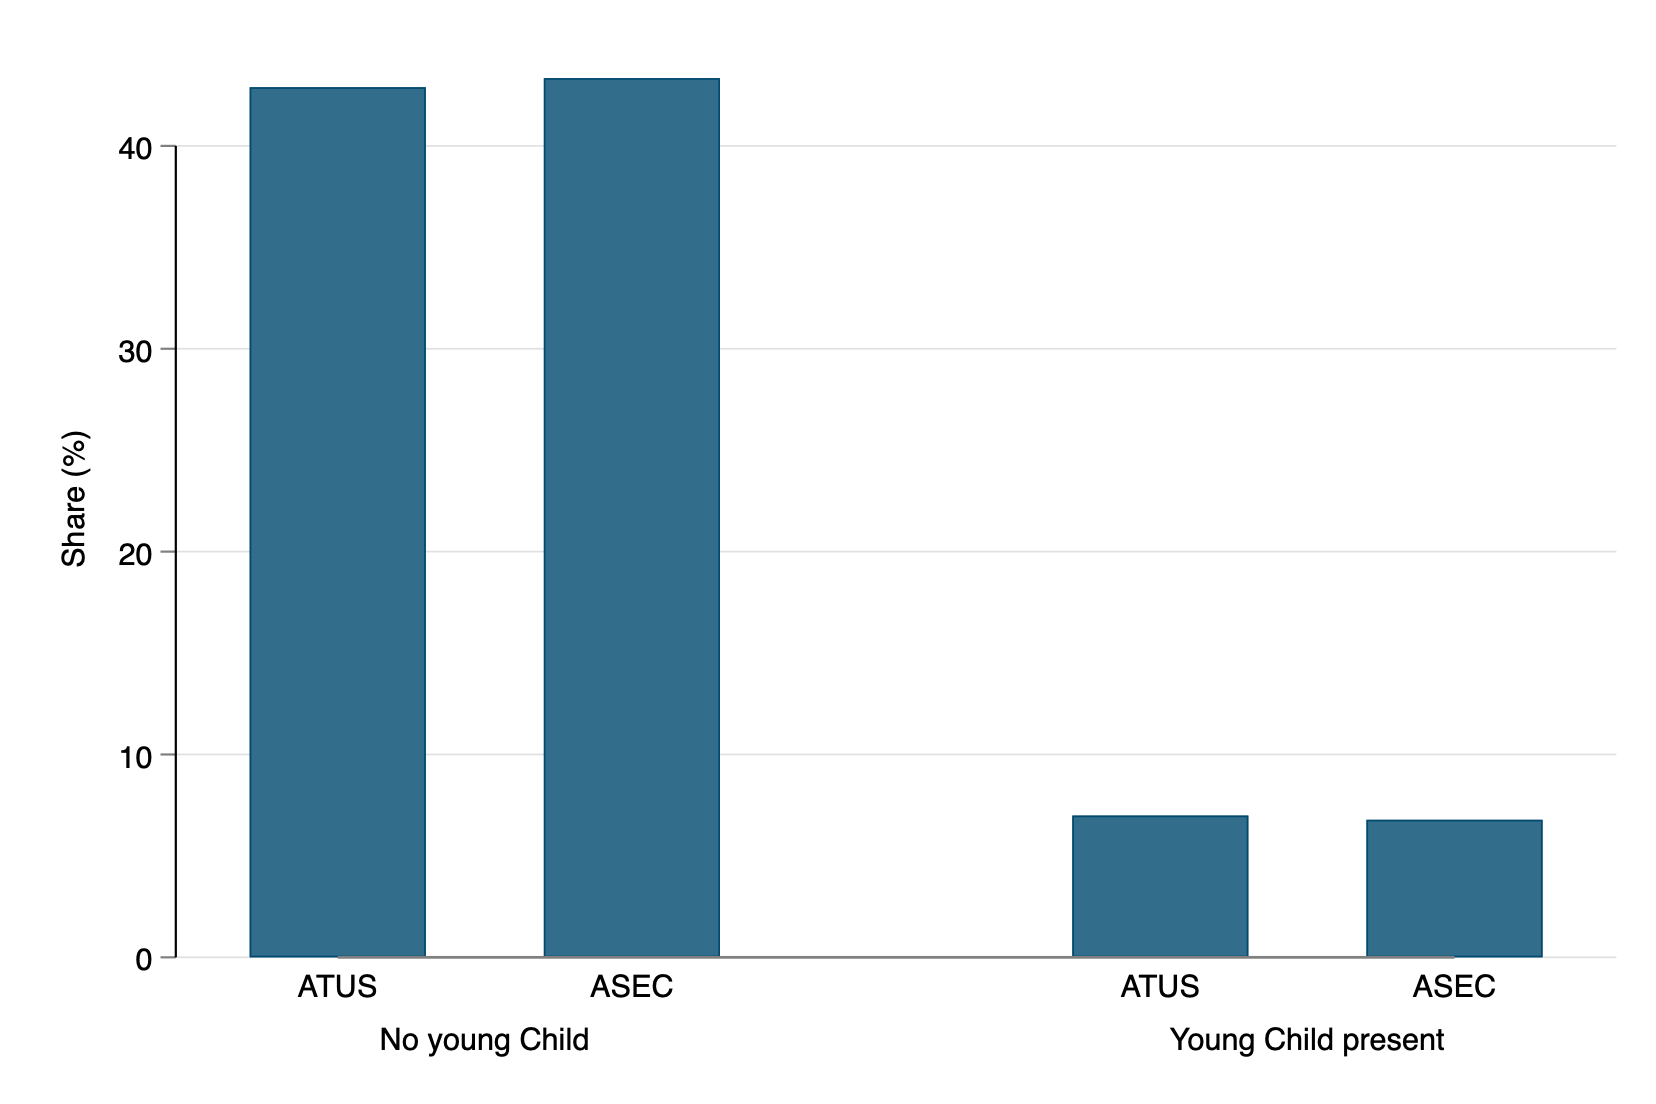
Young Child
Weekend

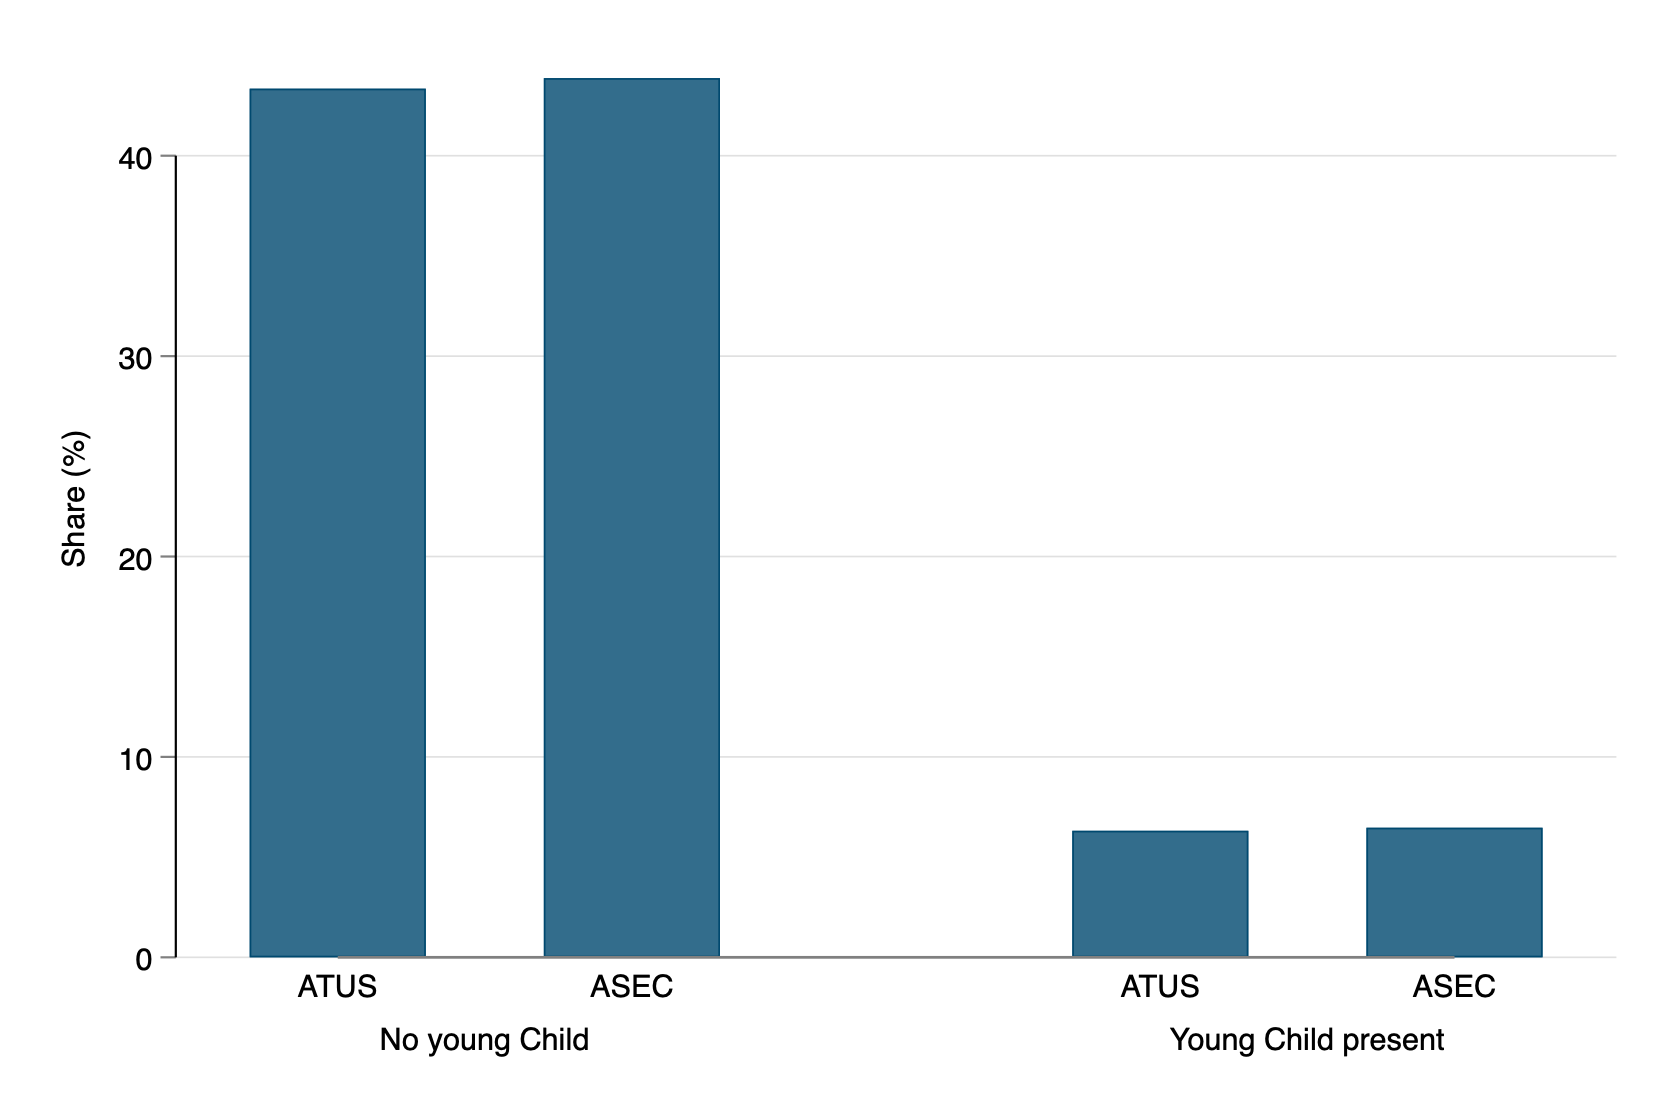
Weekday


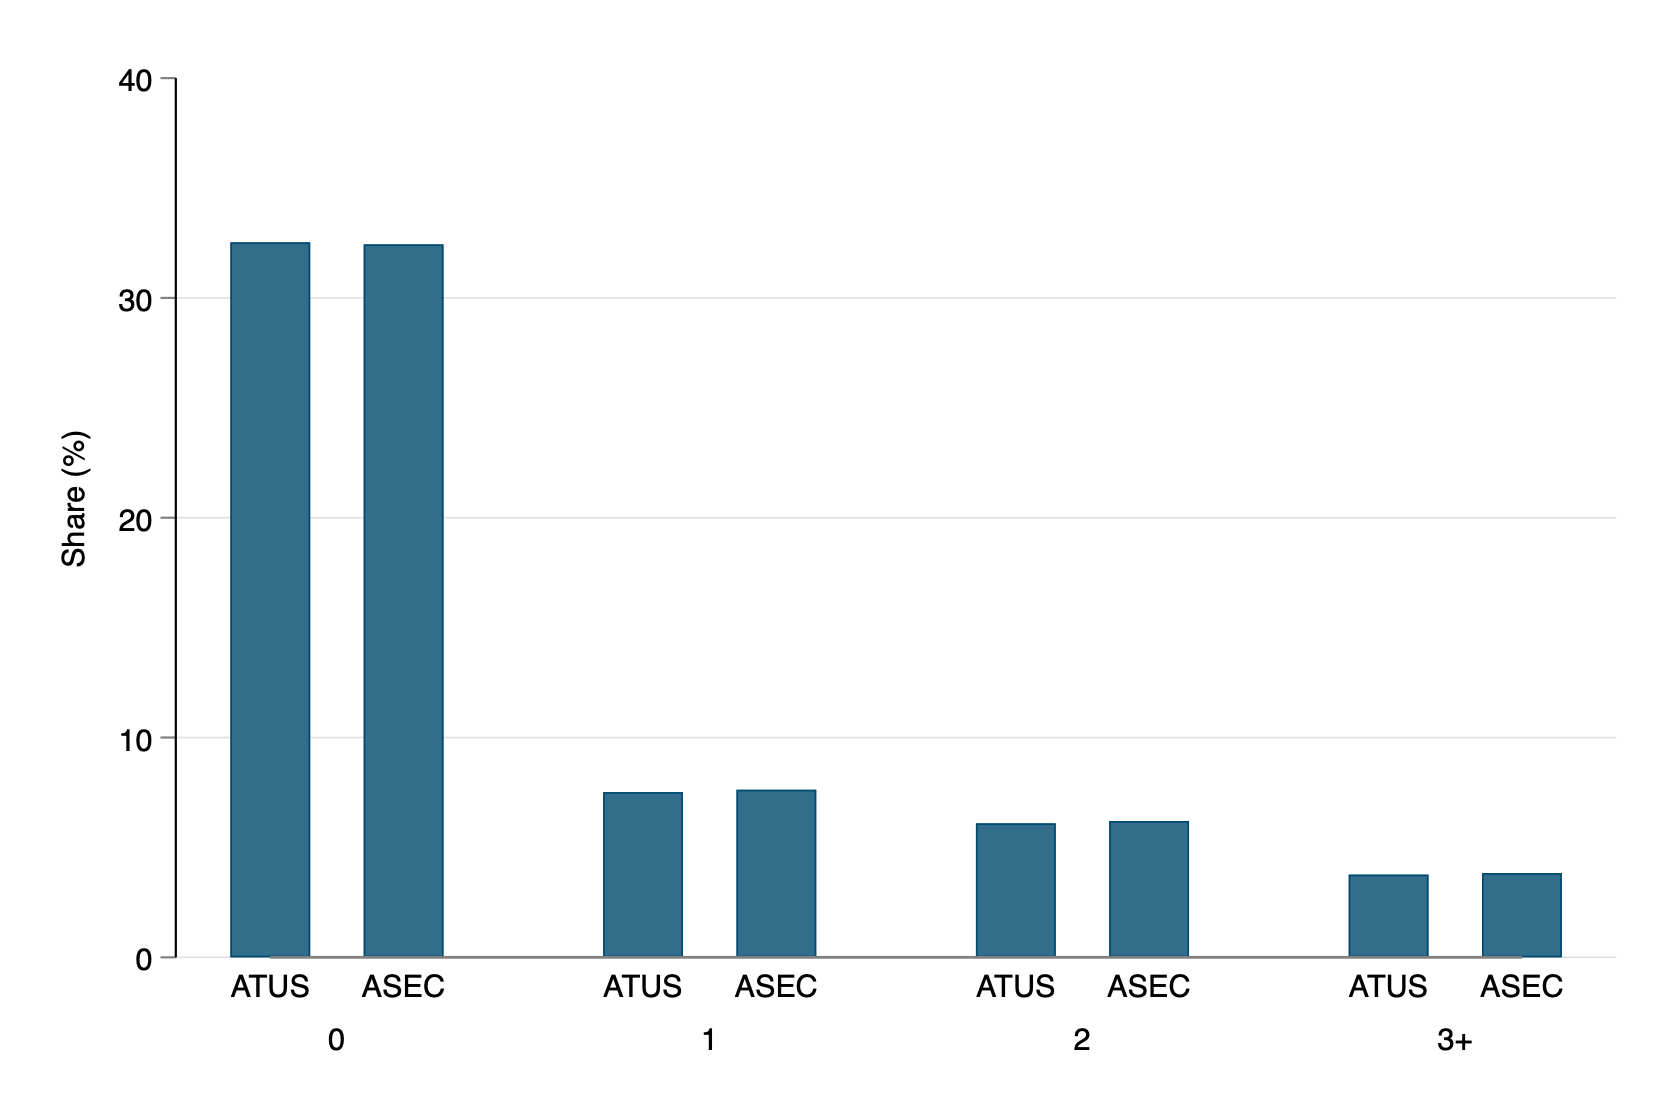
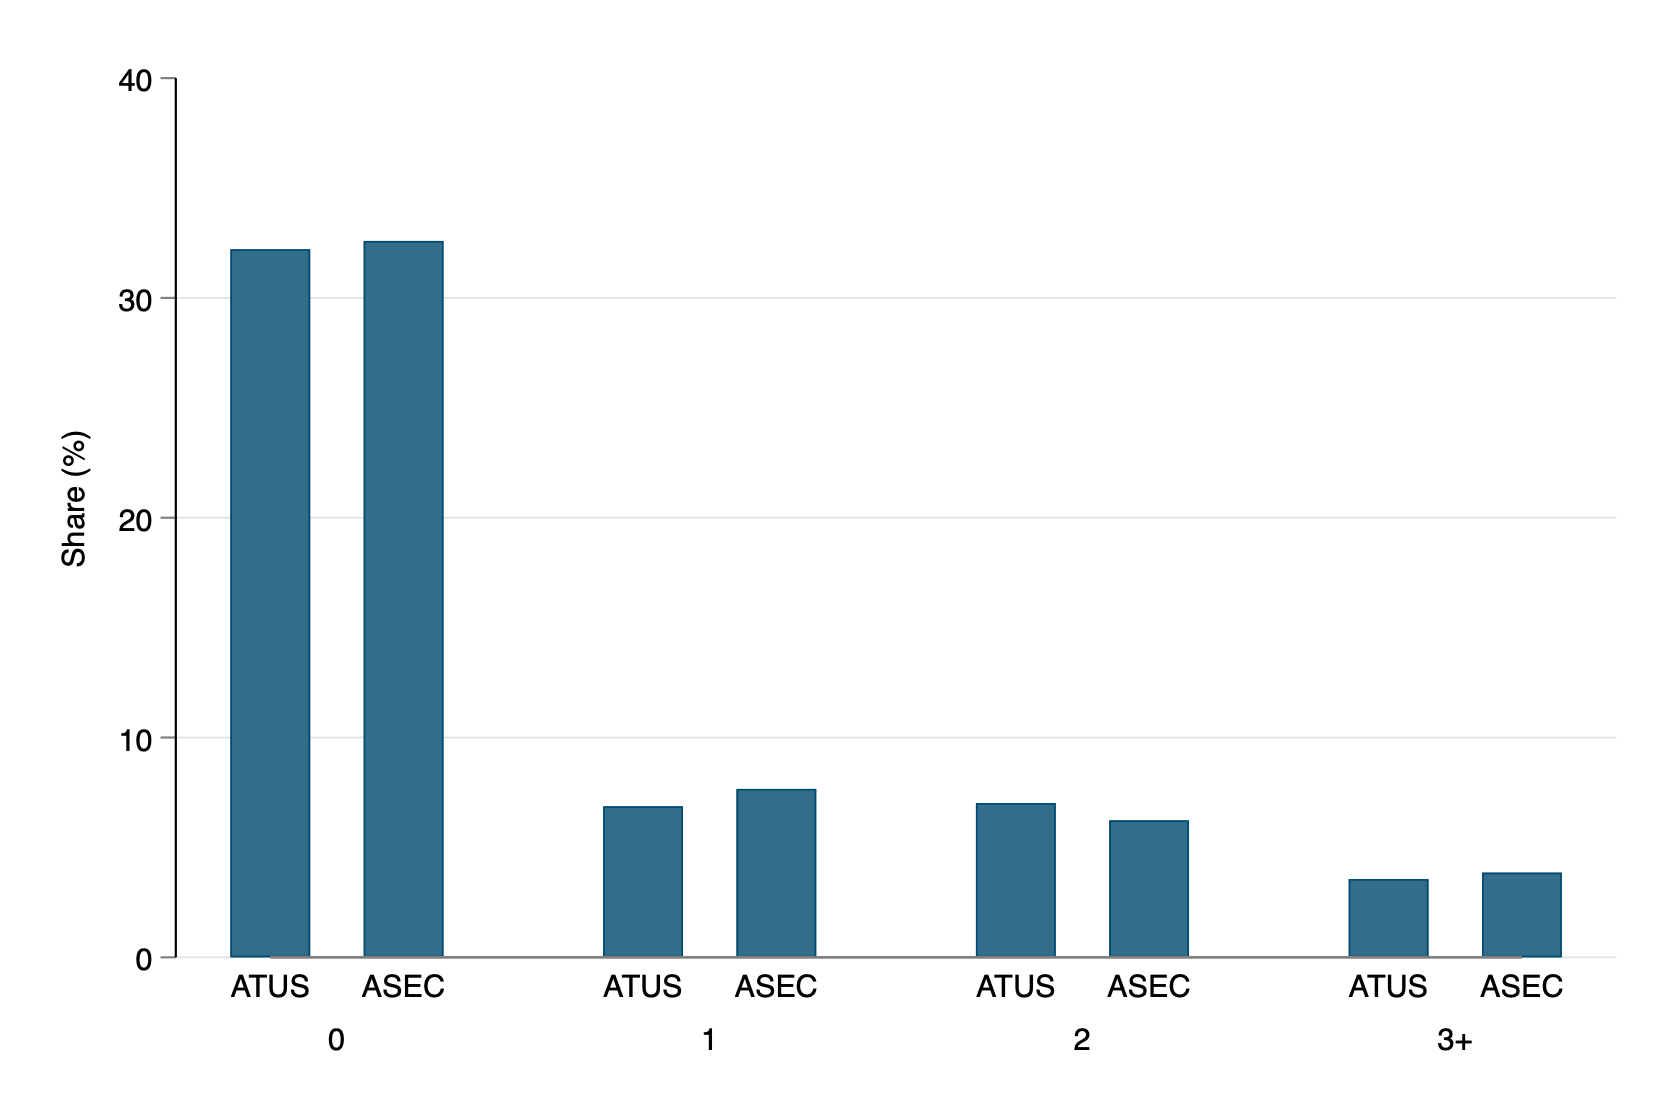
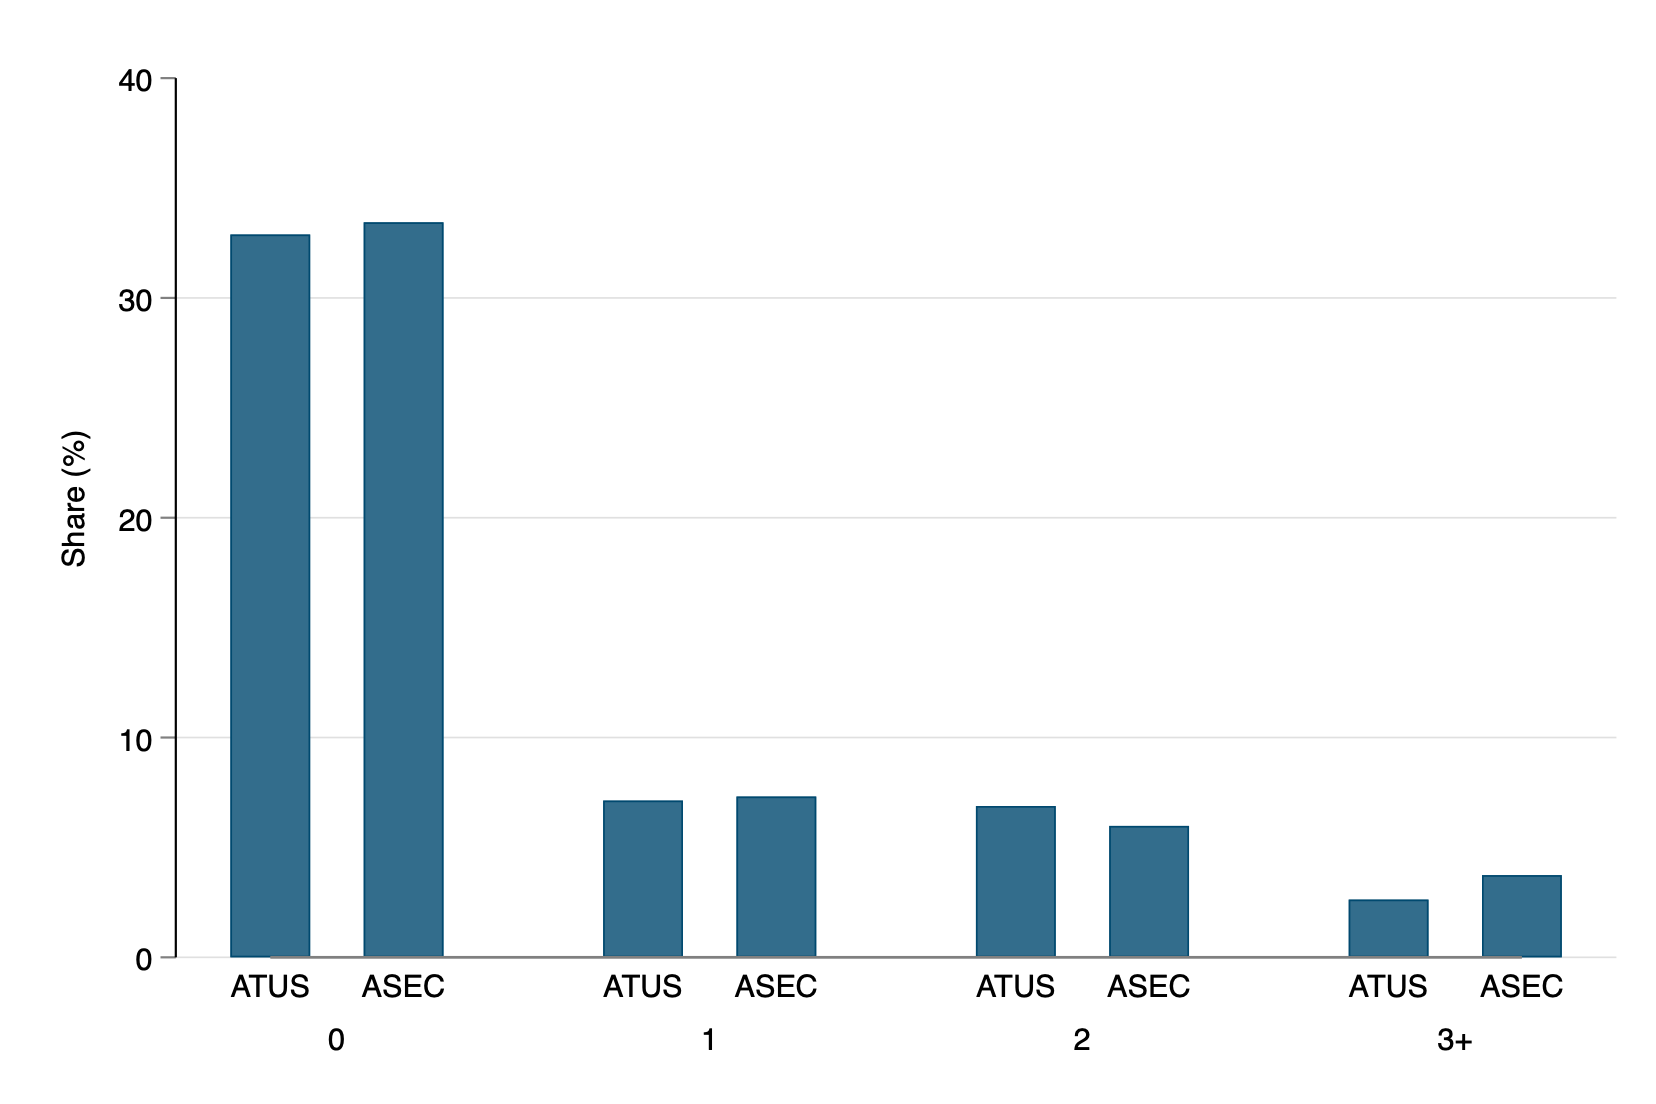
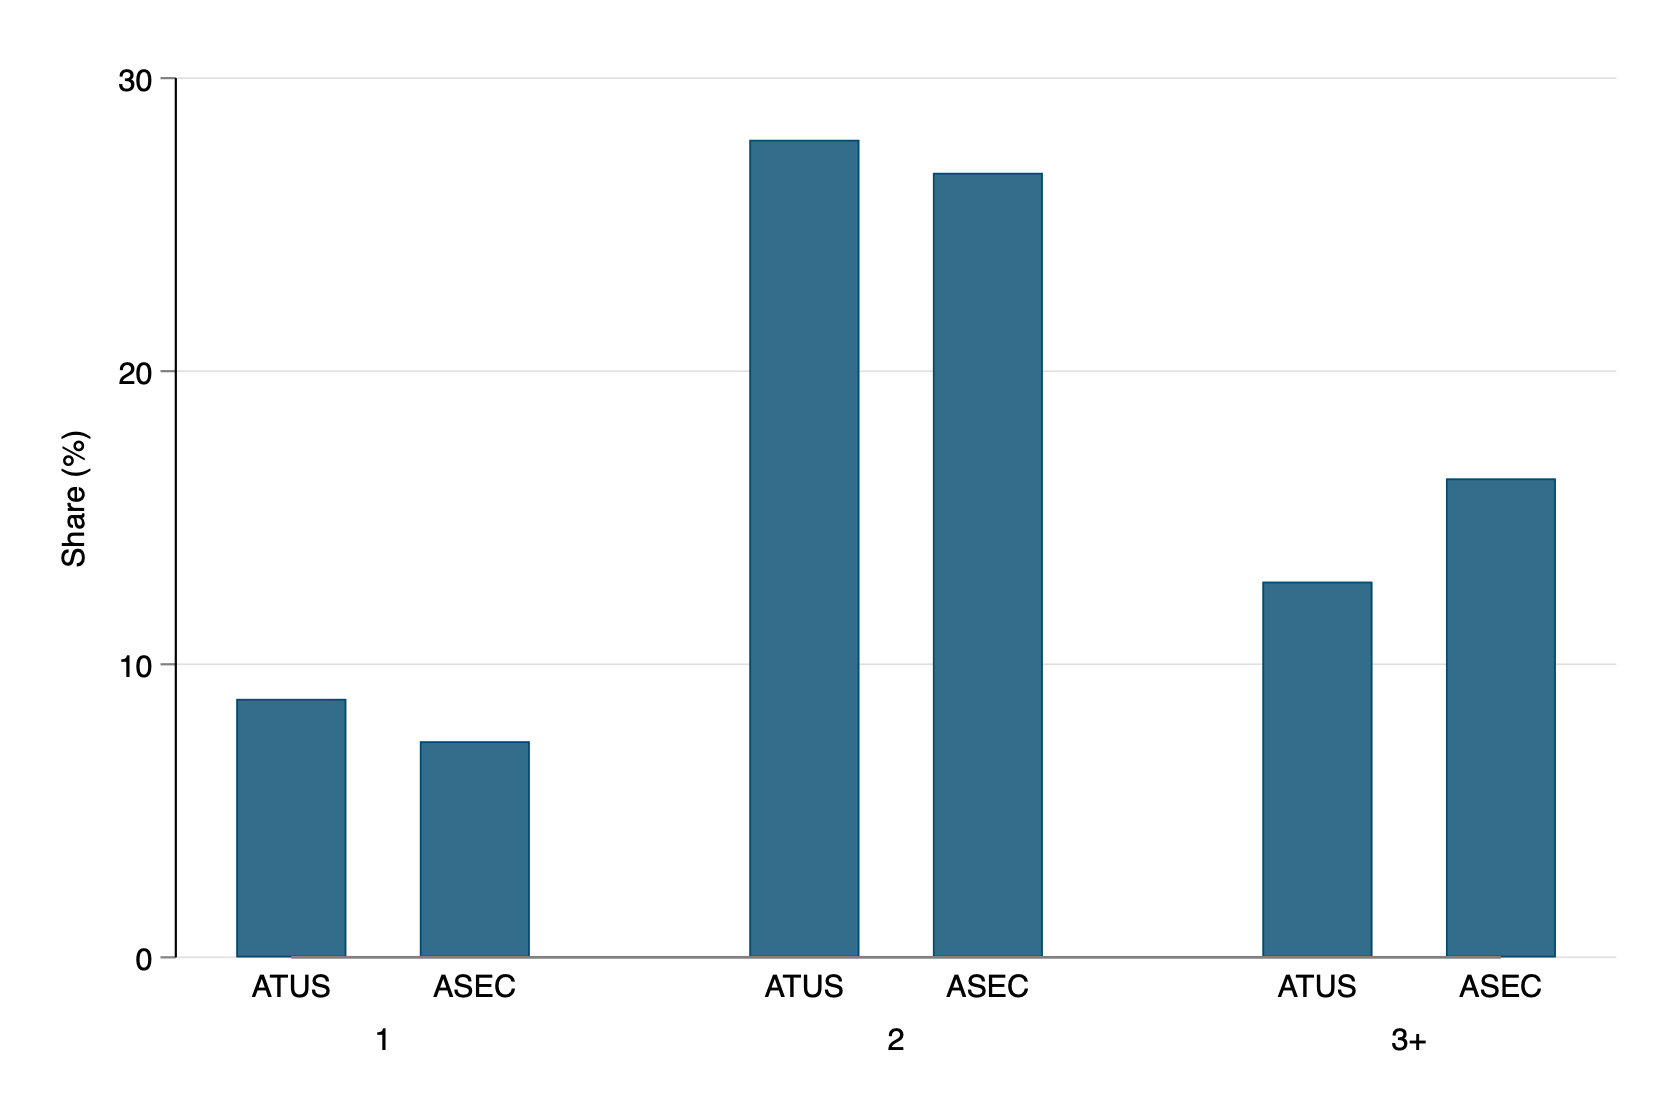
# Children
Weekend

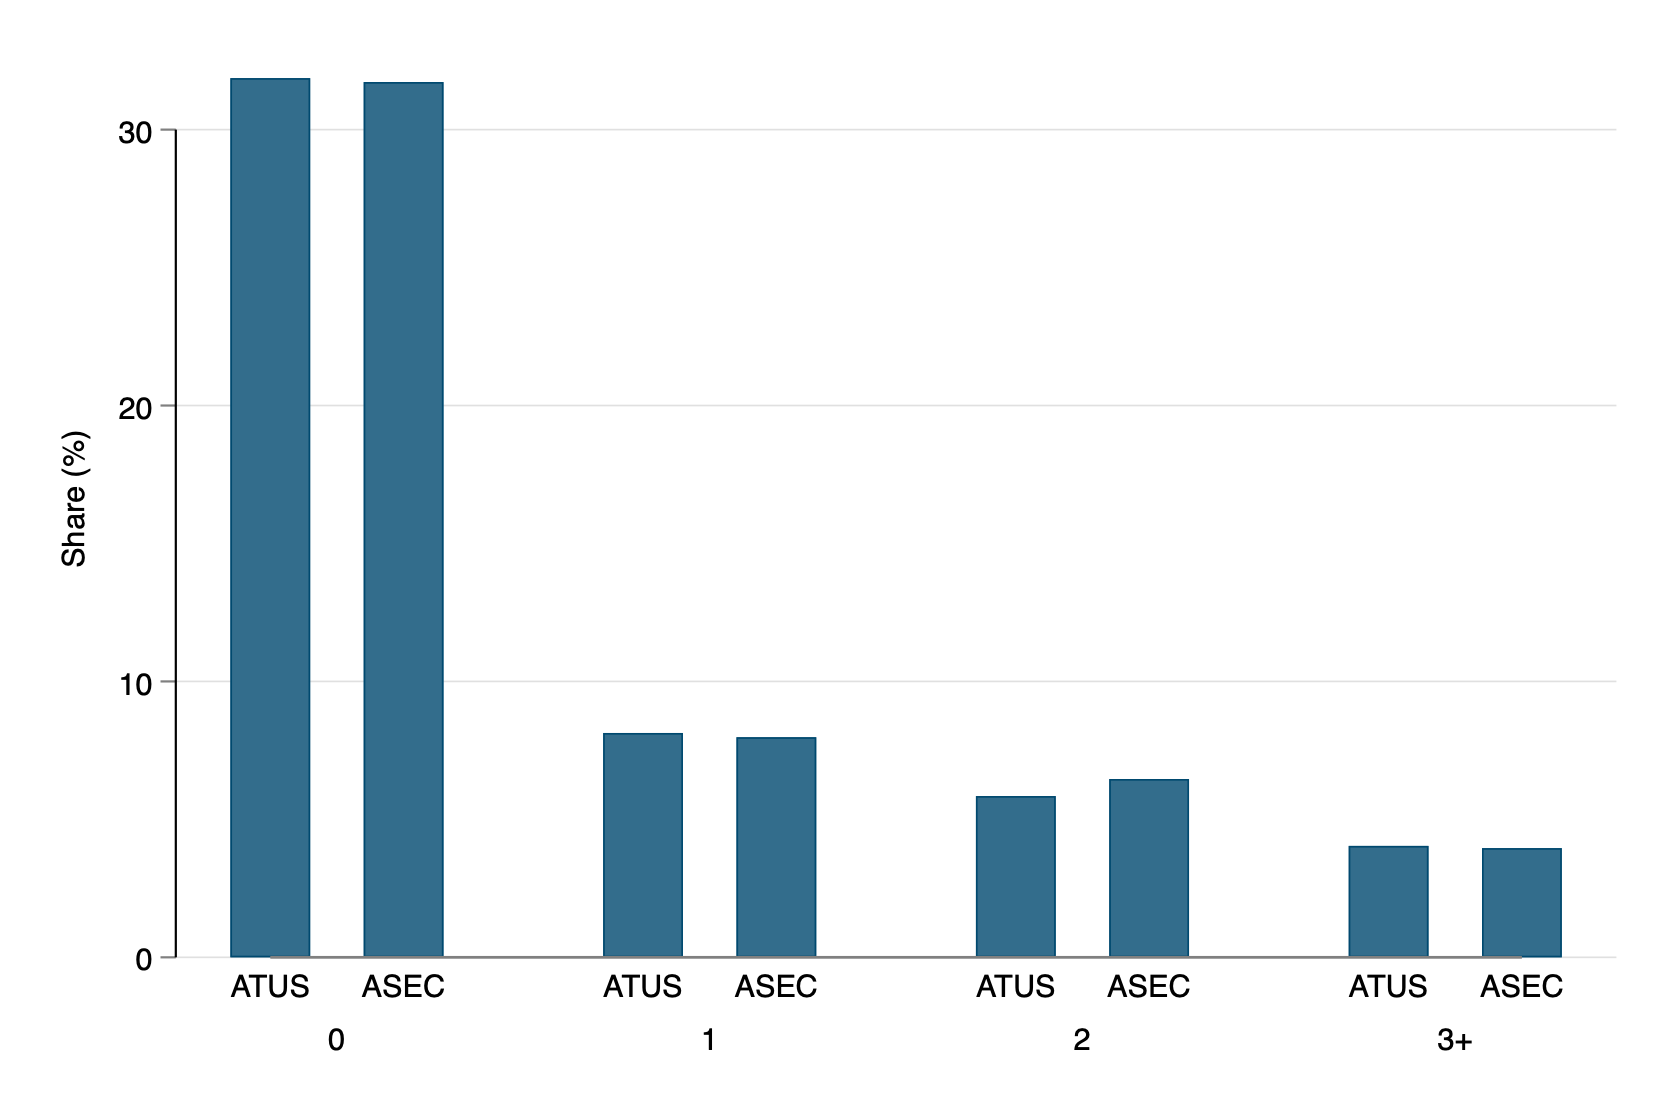
Weekday

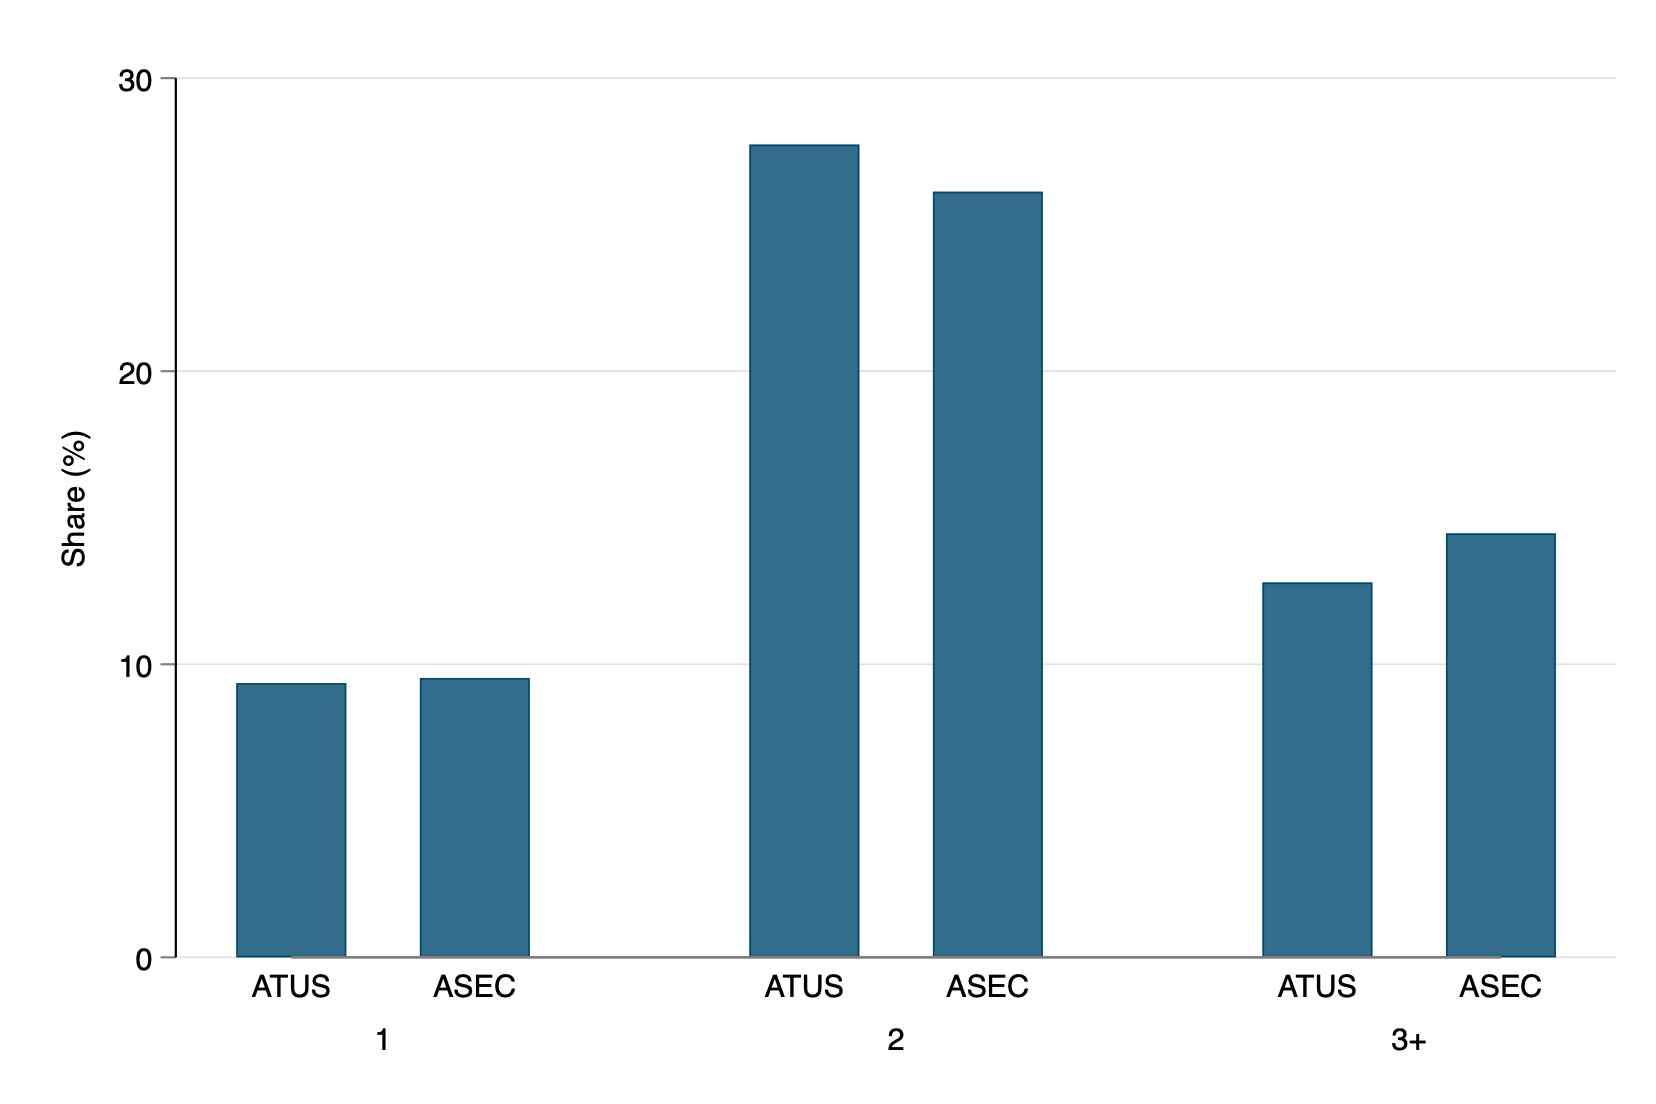
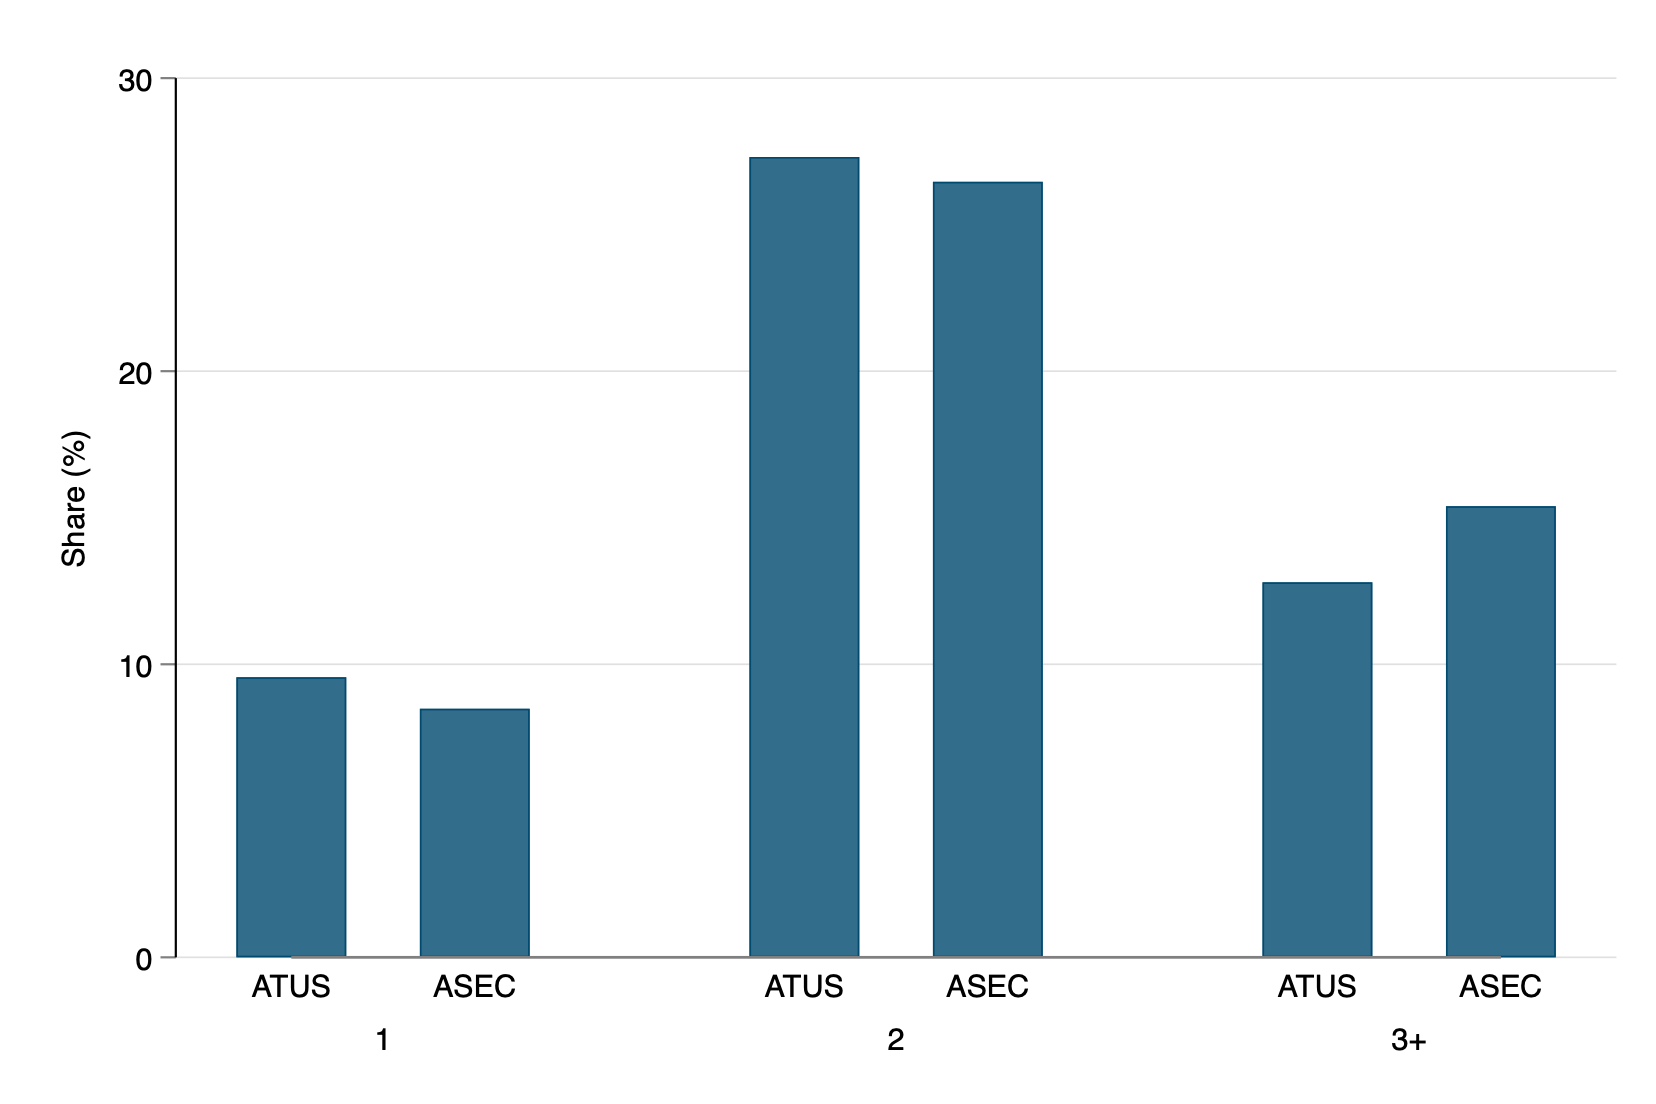
# Adults
Weekend


Weekday

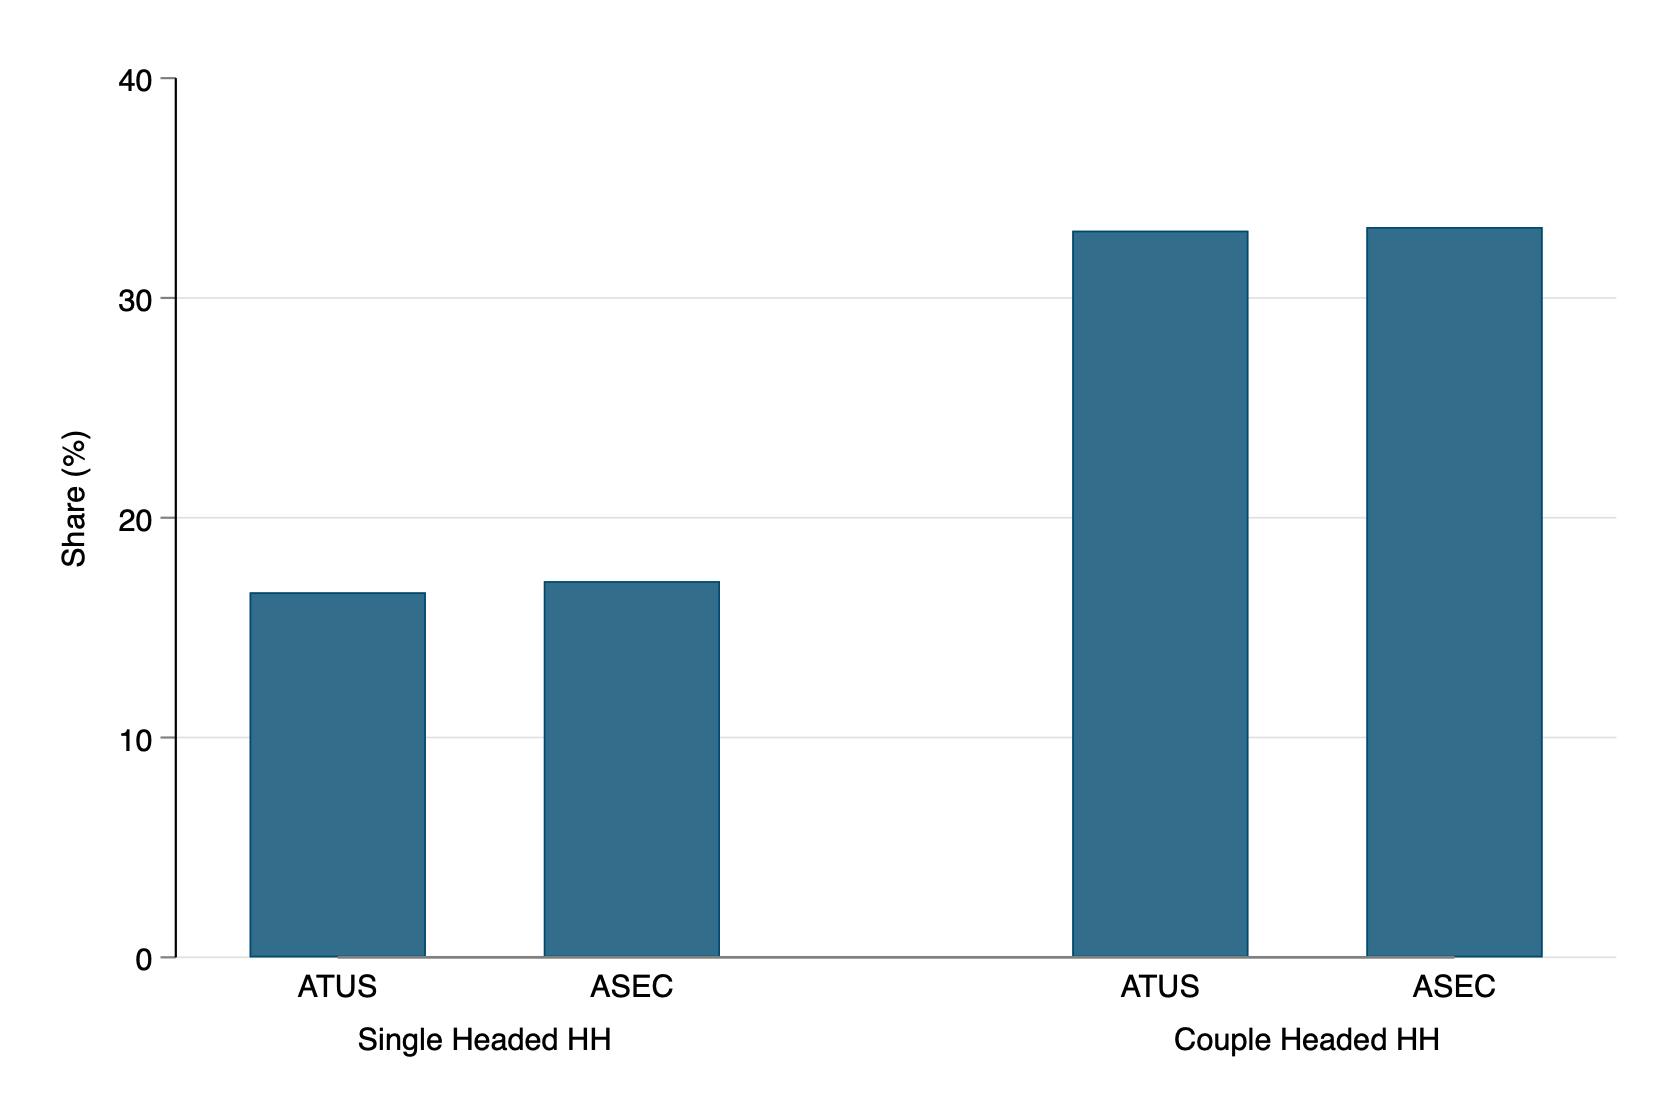
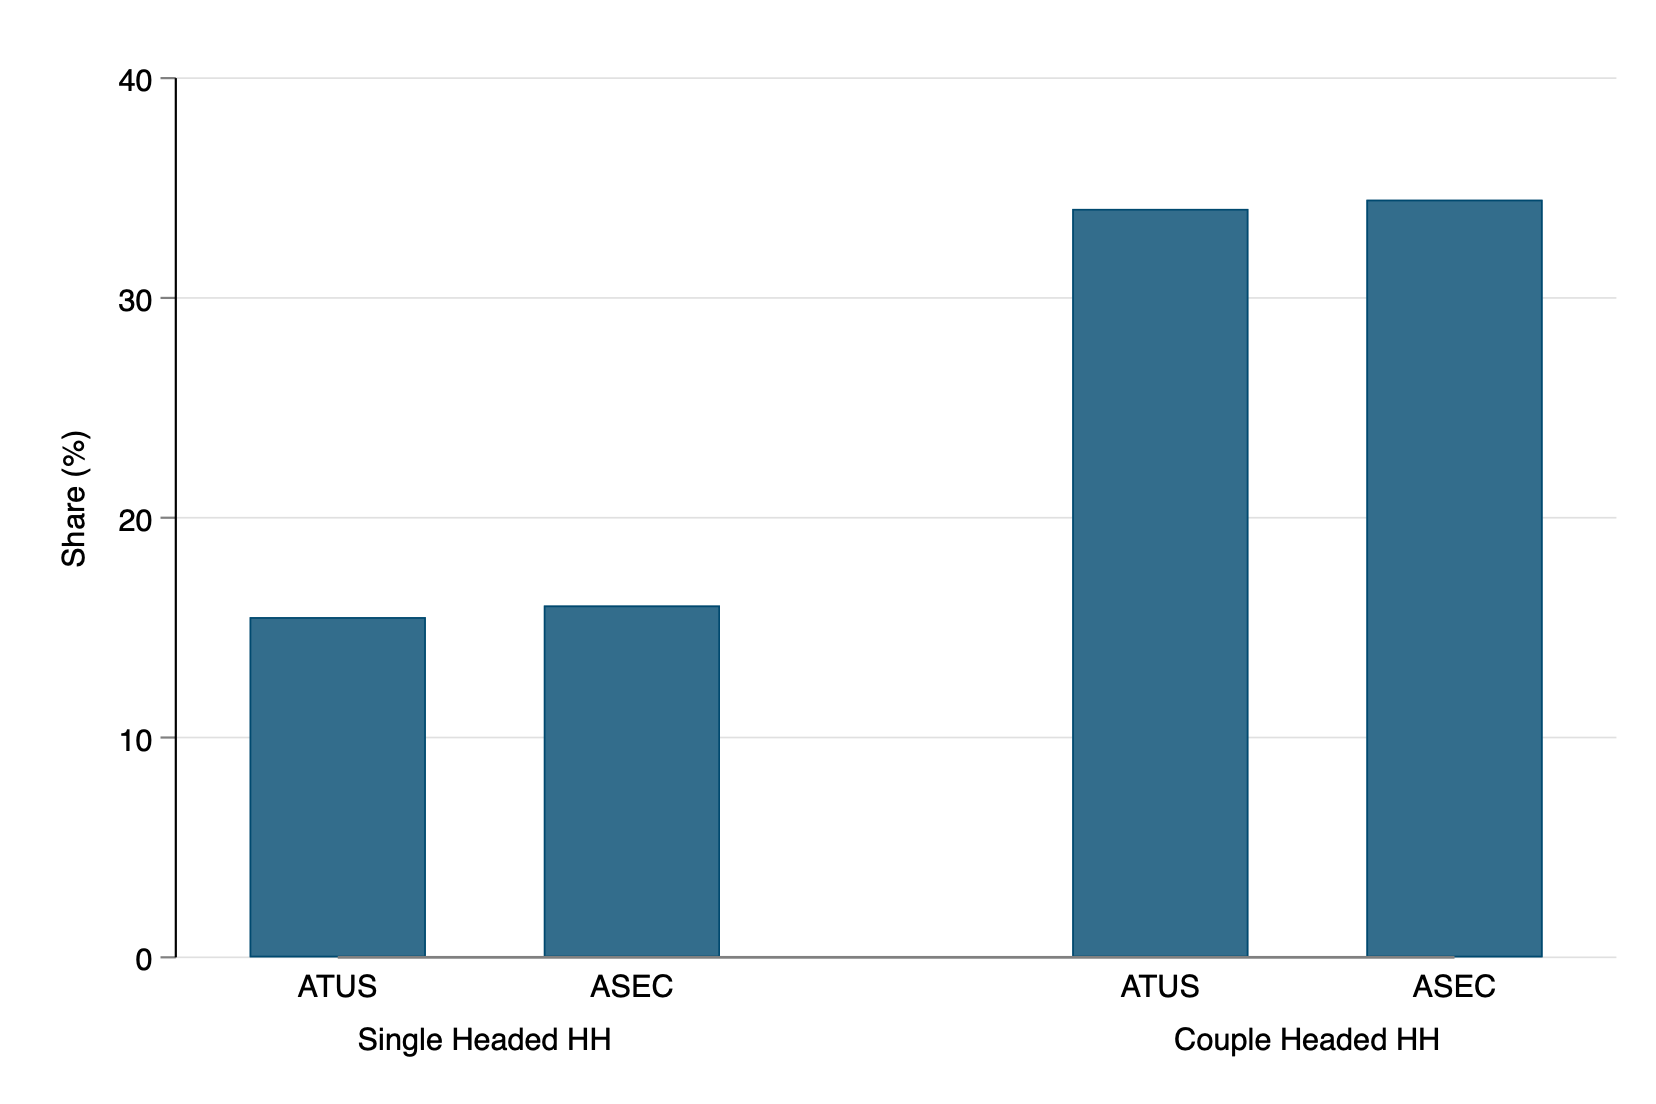
Couple
Weekend
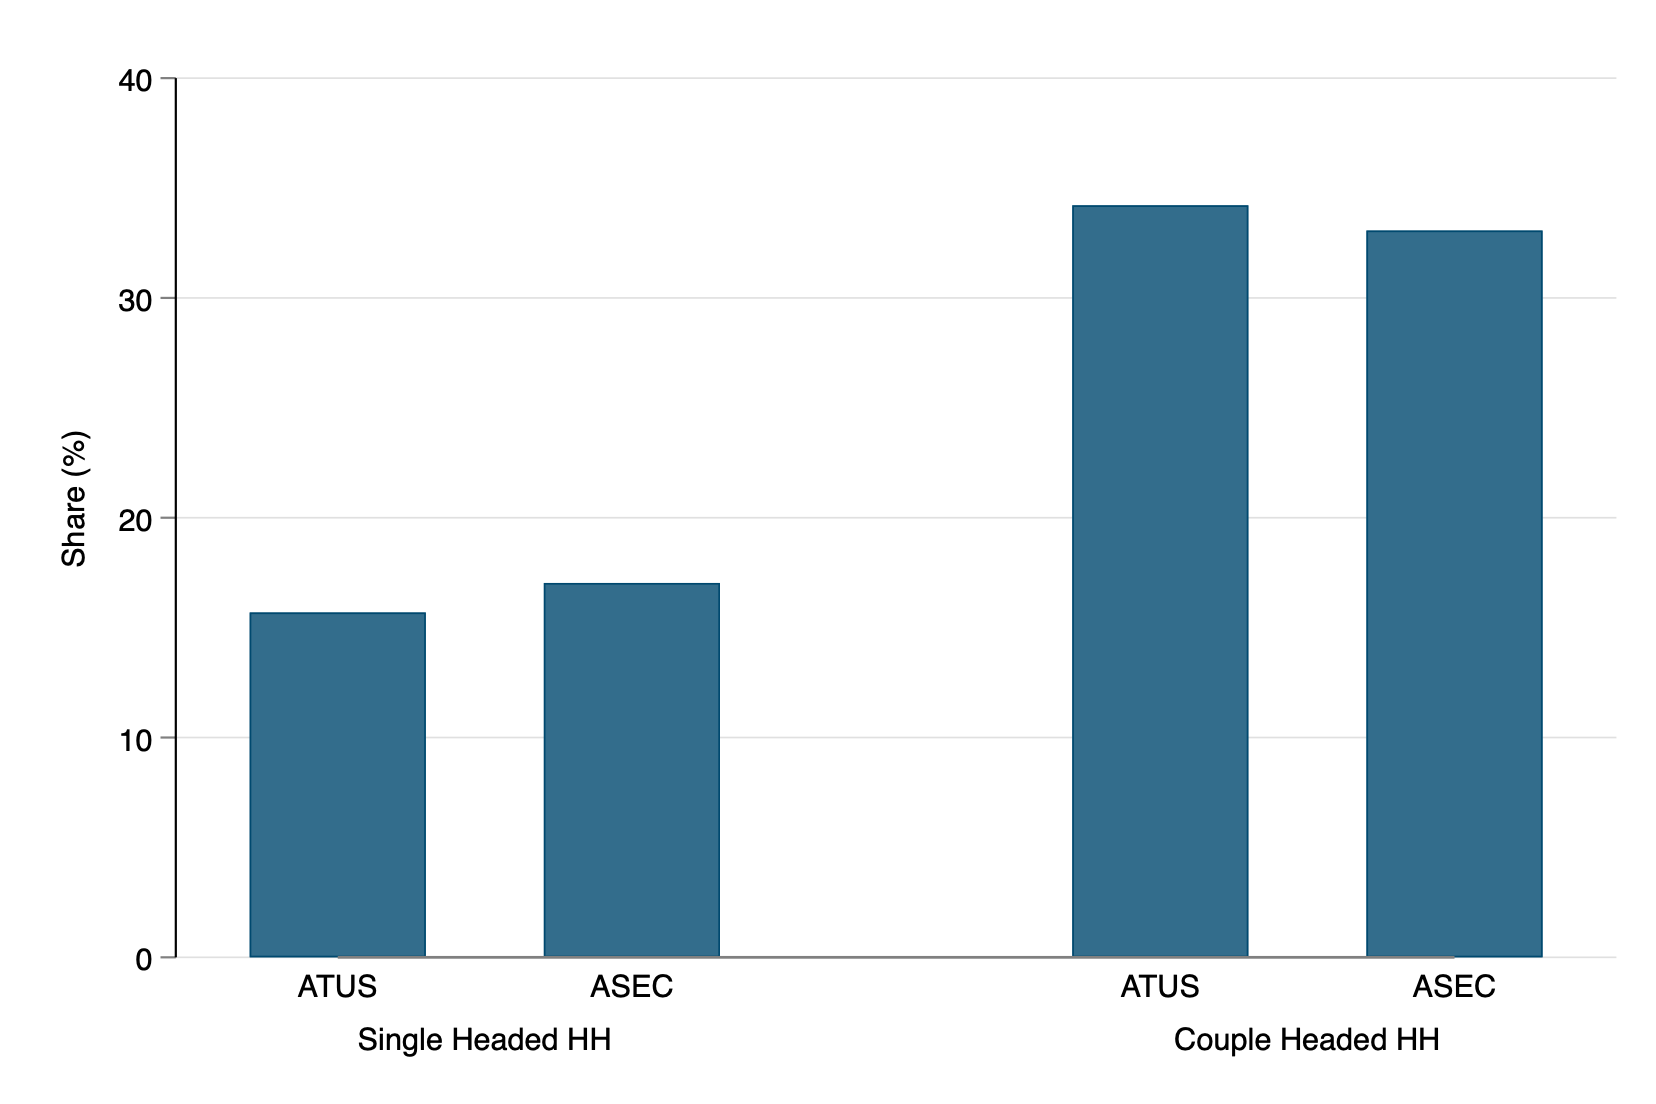
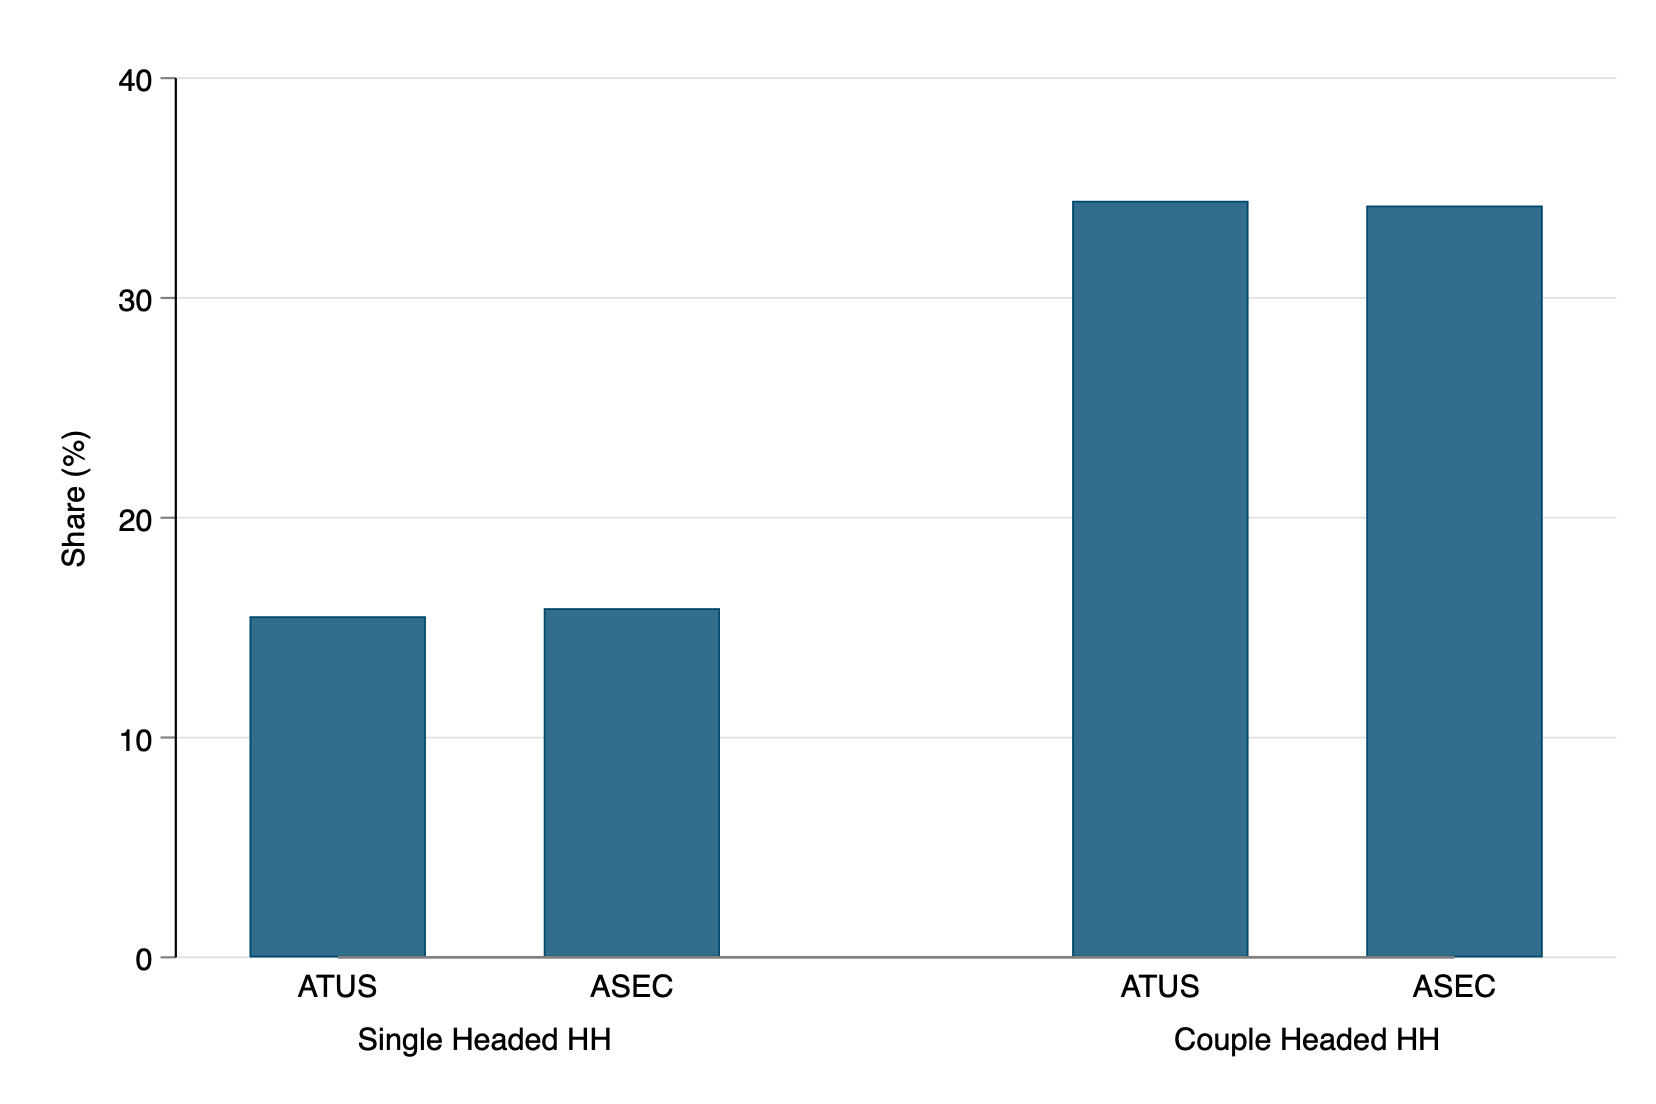

Weekday

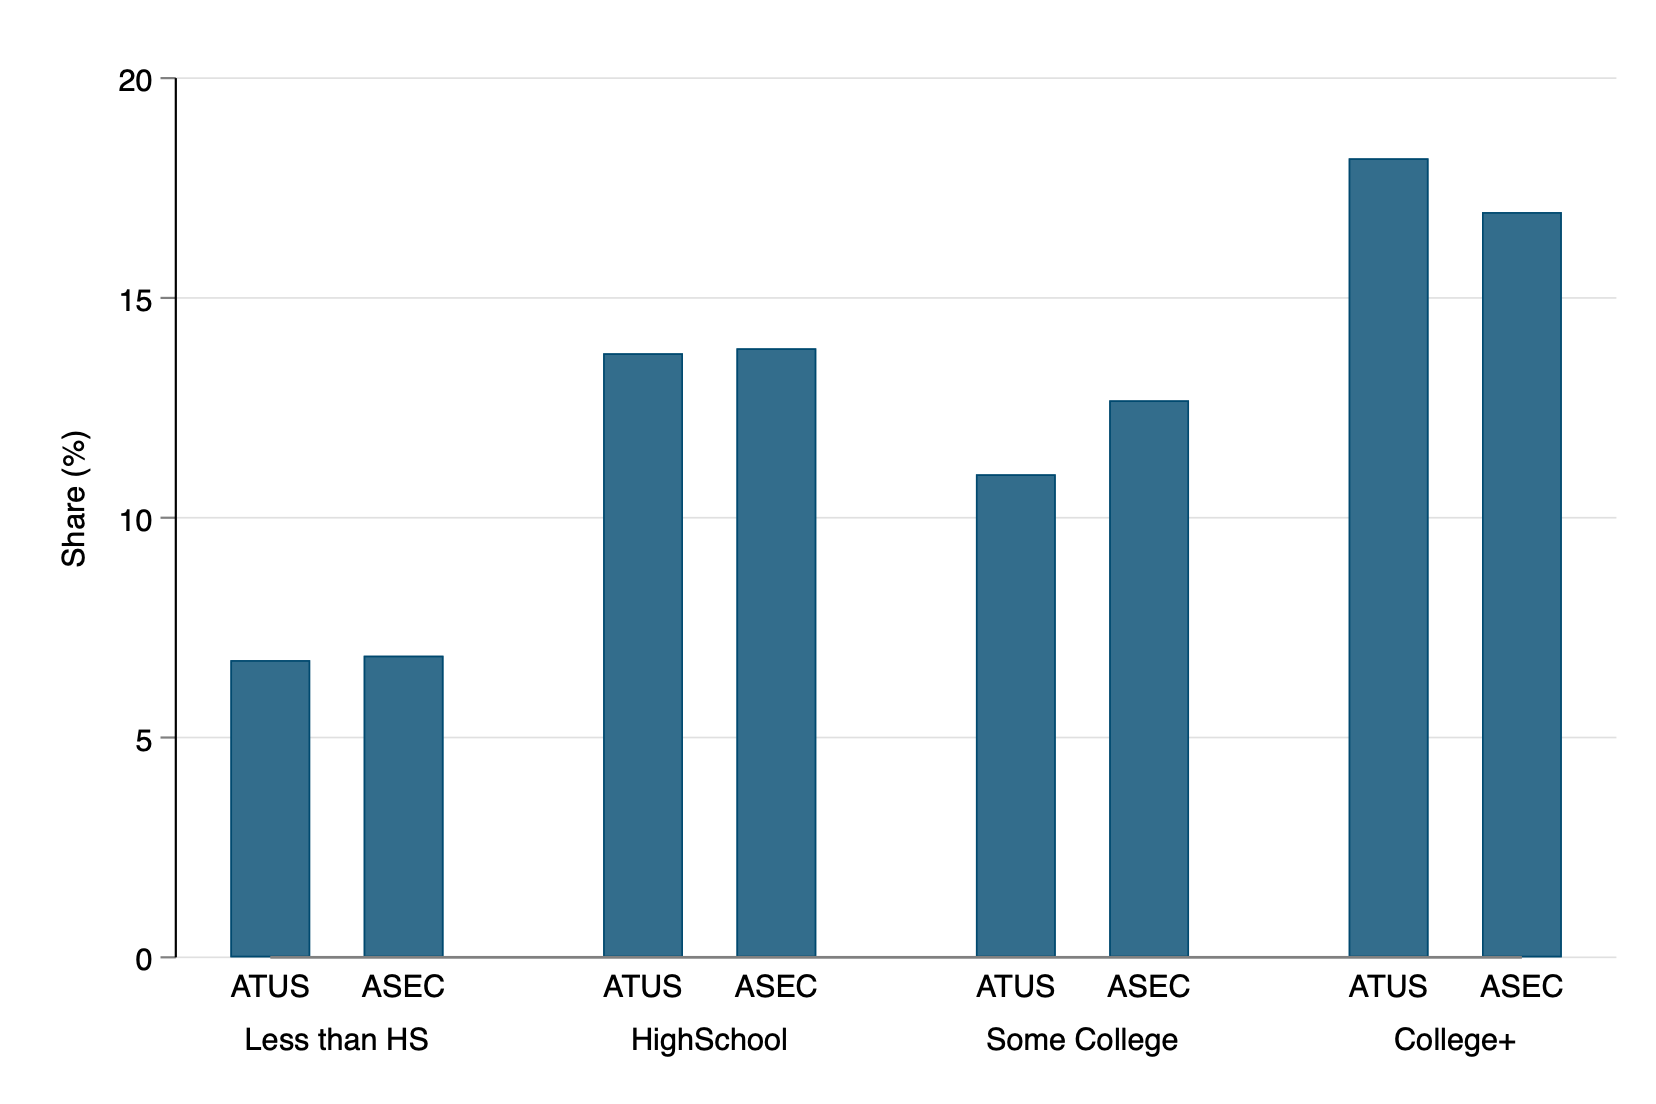
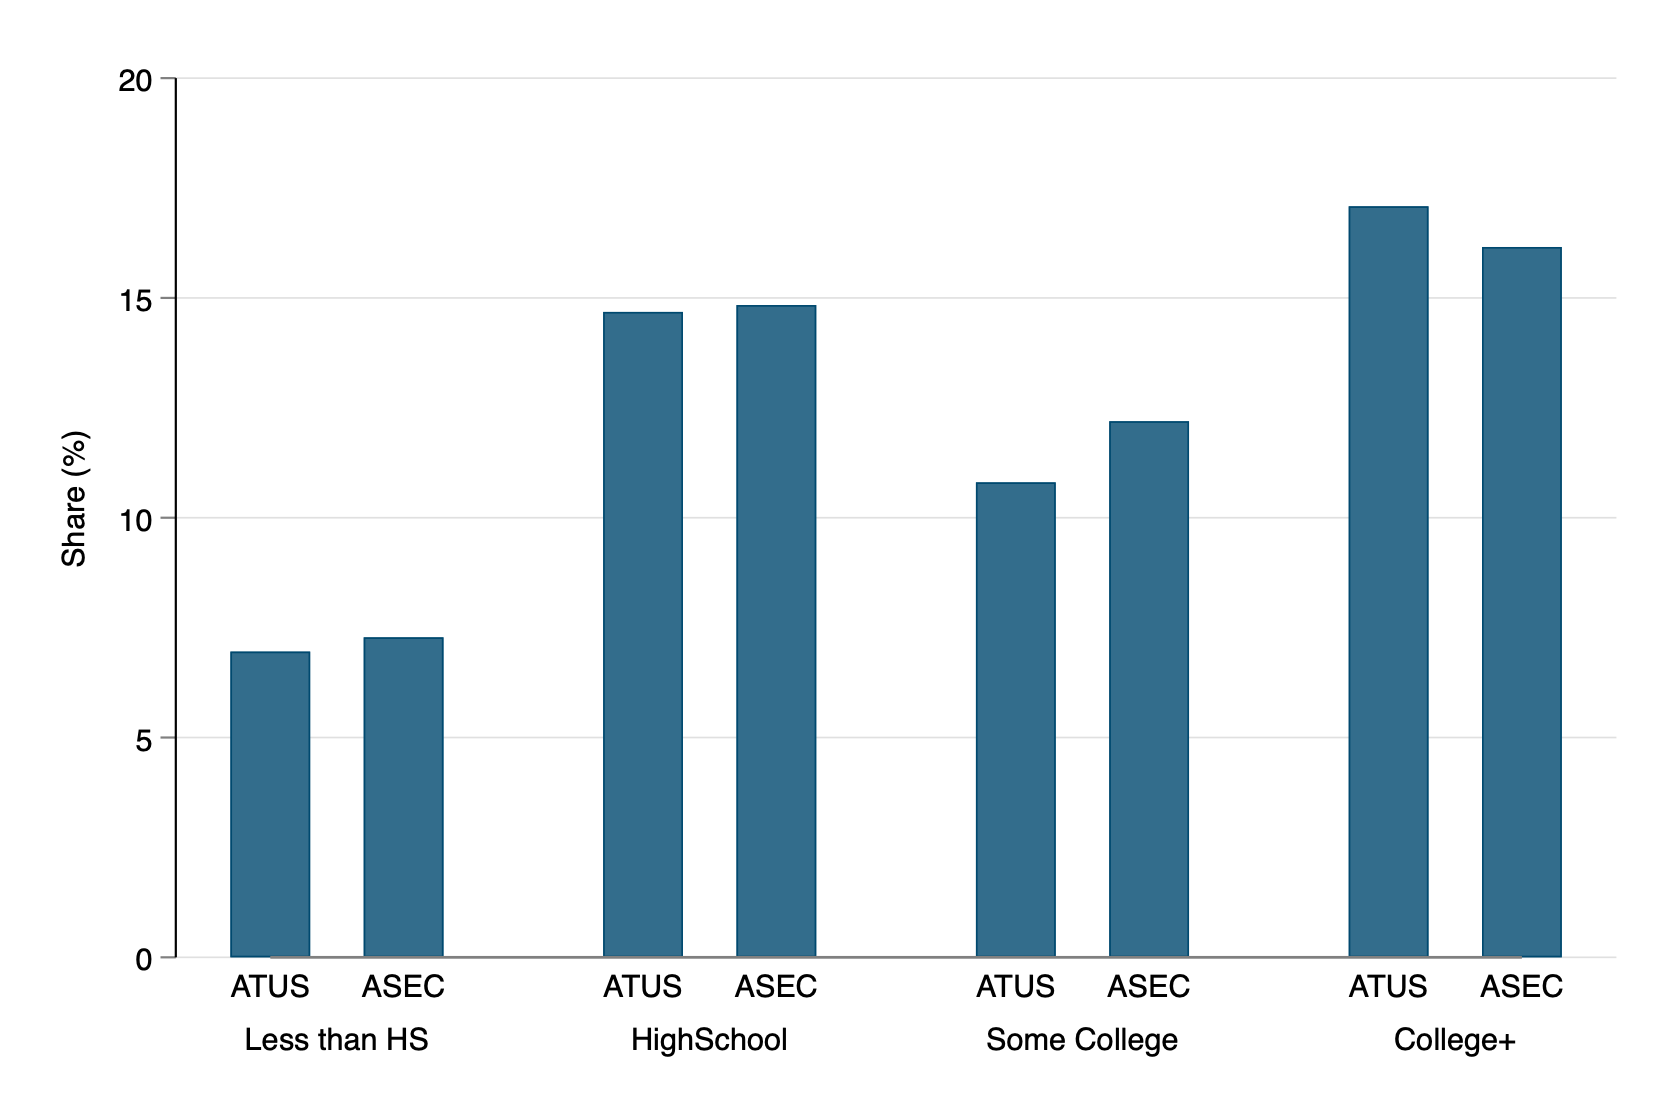
Education
Weekend
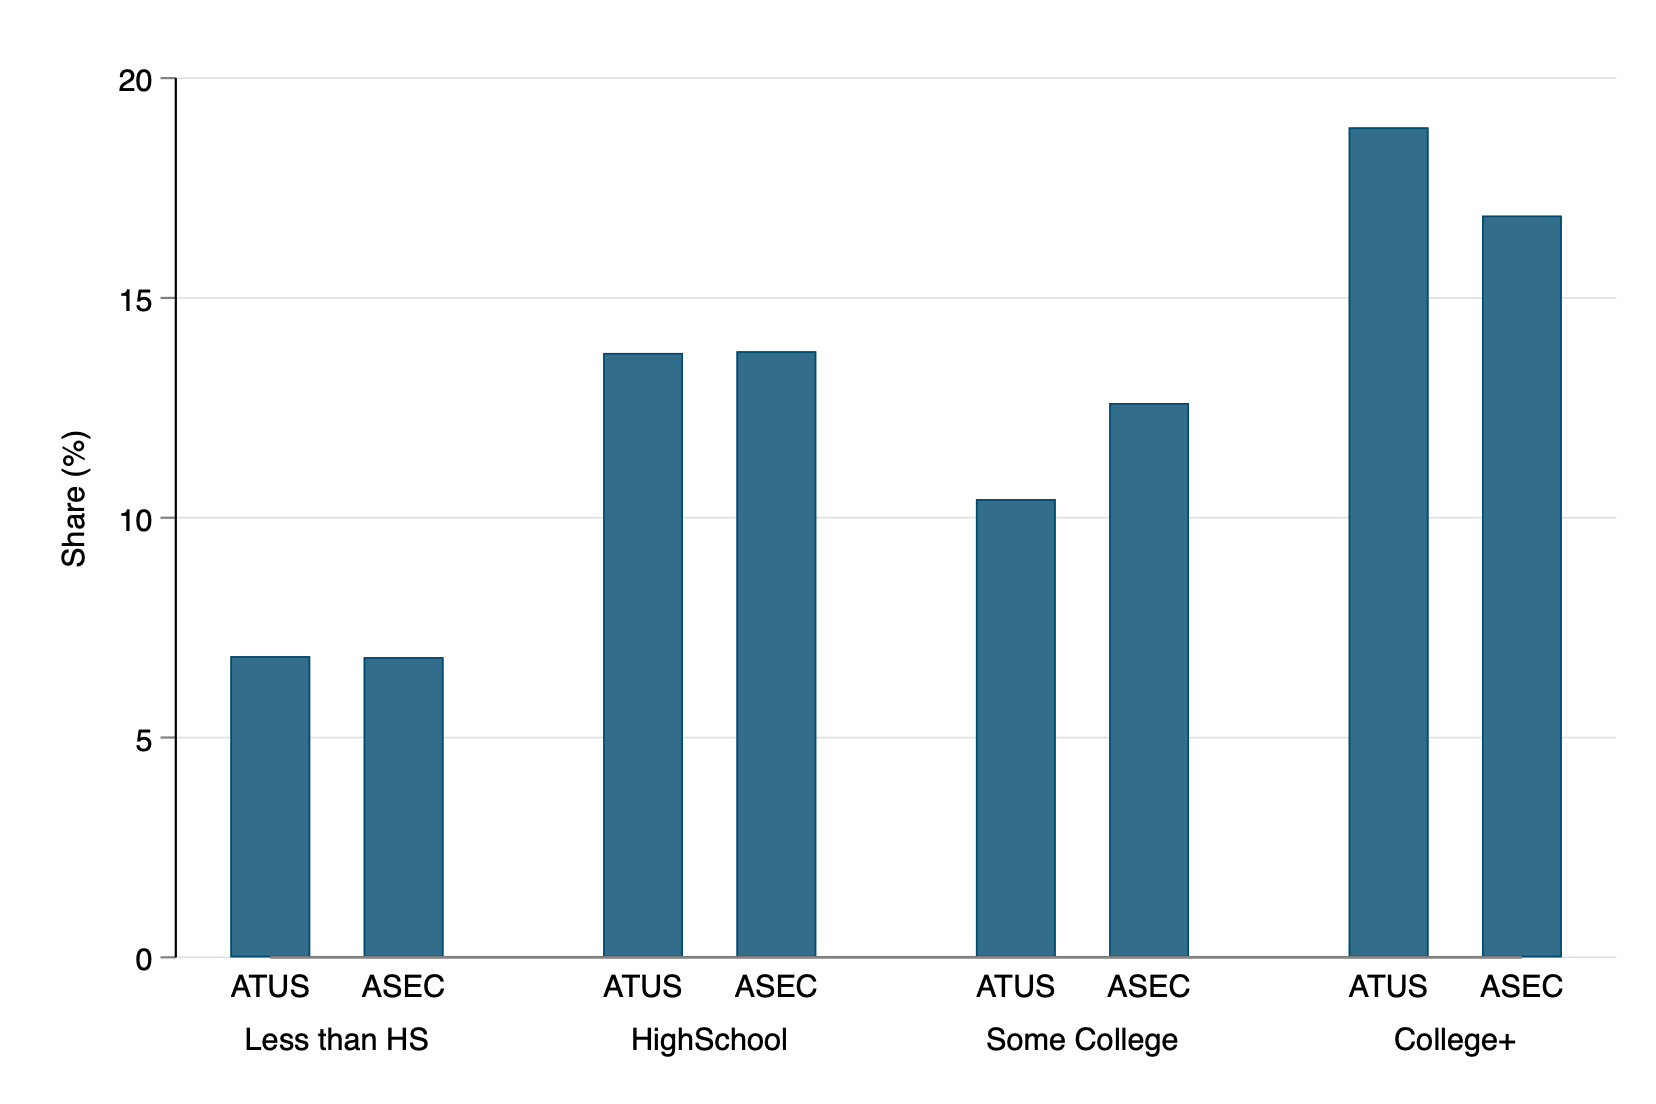
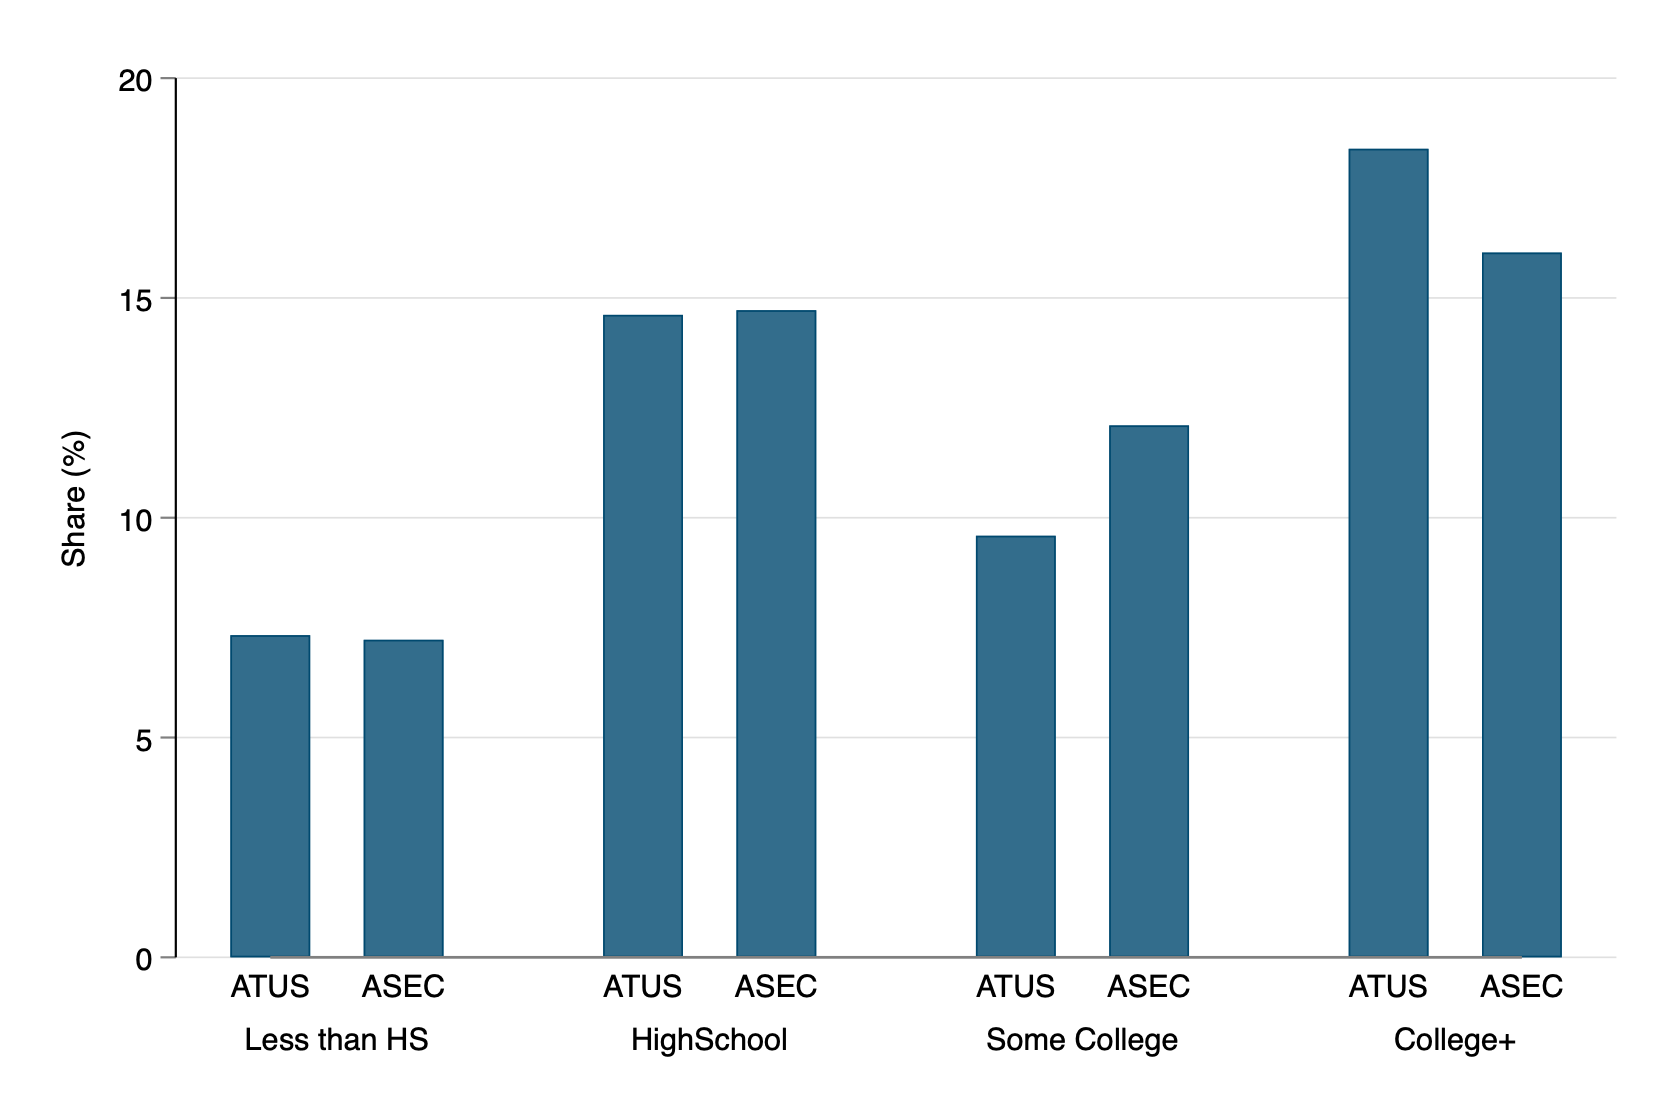
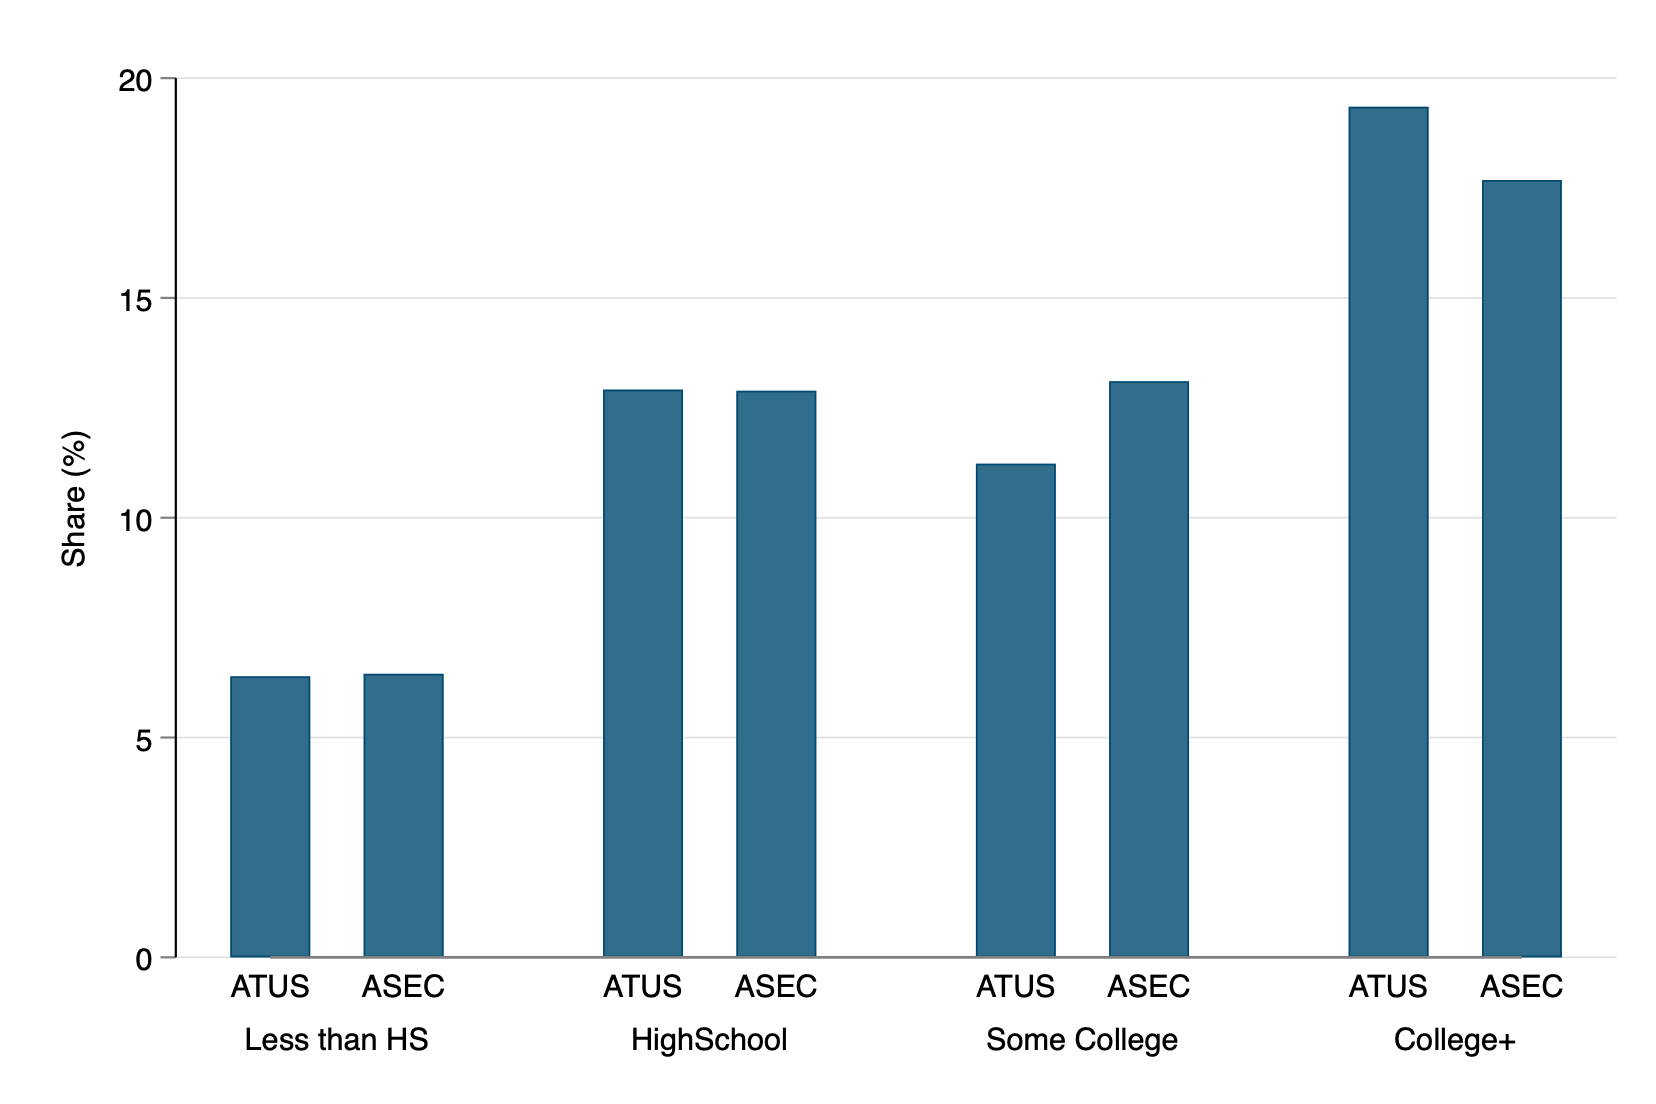
Weekday

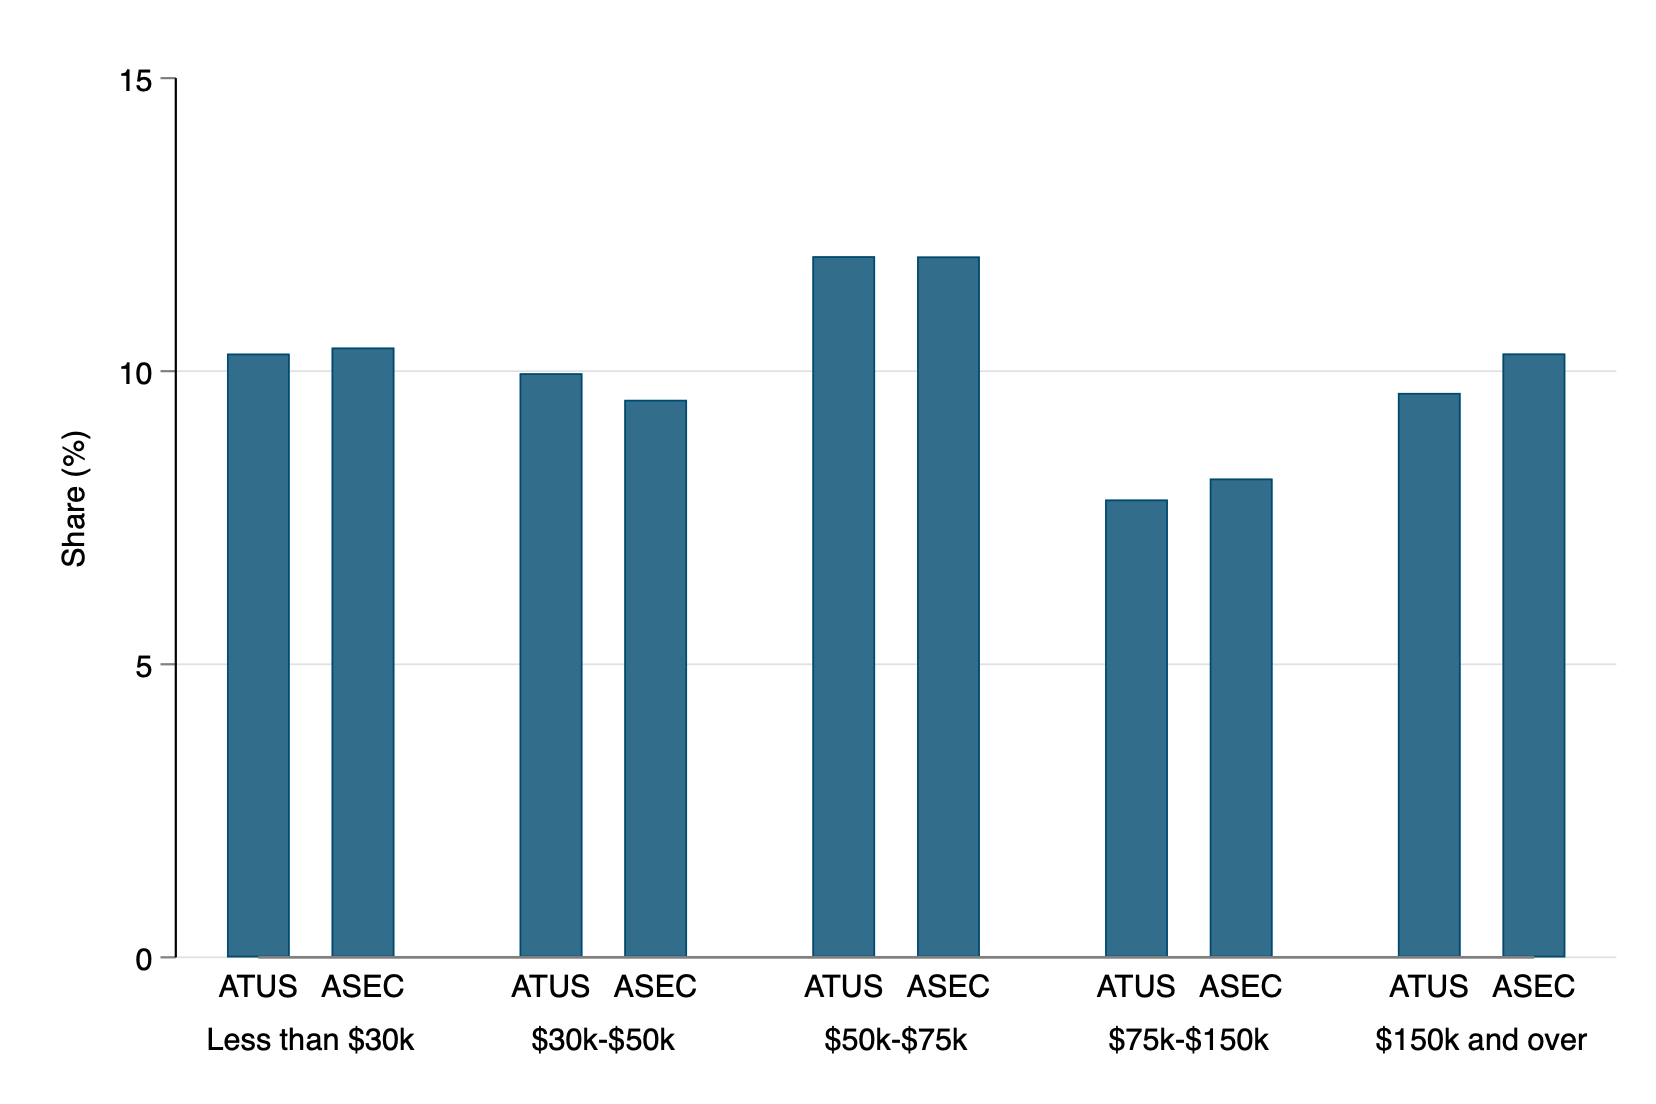
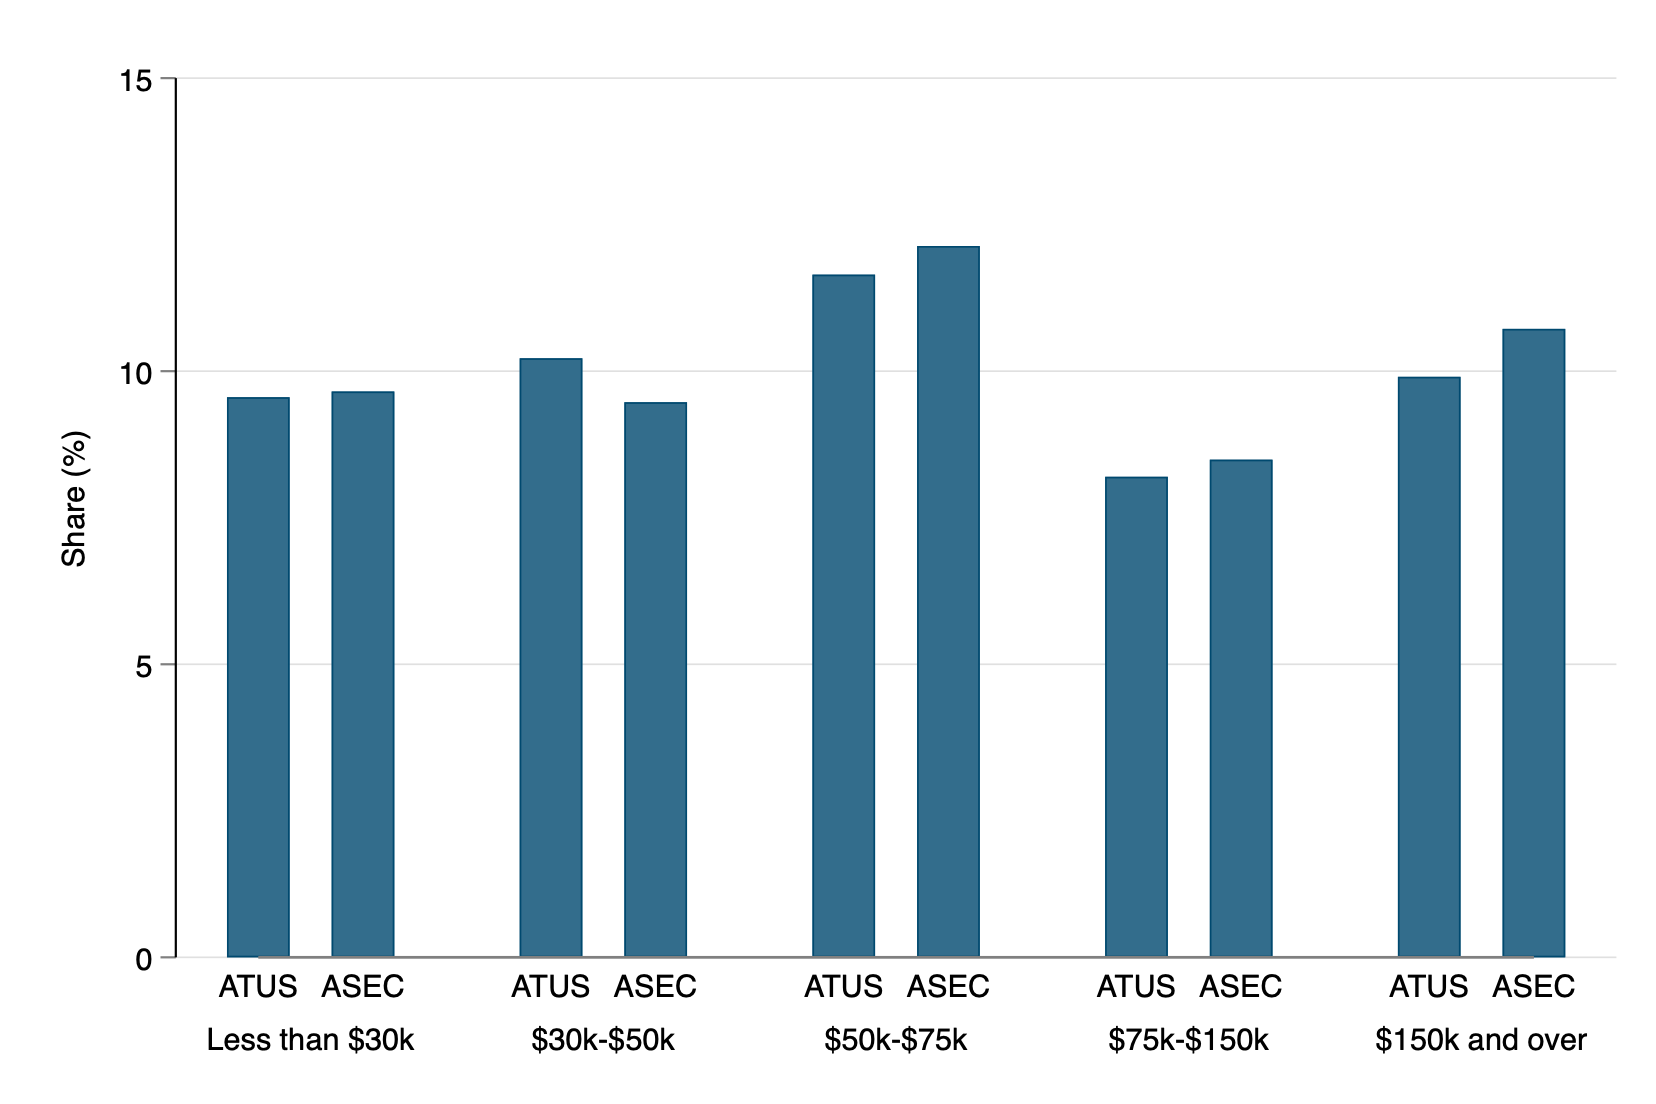
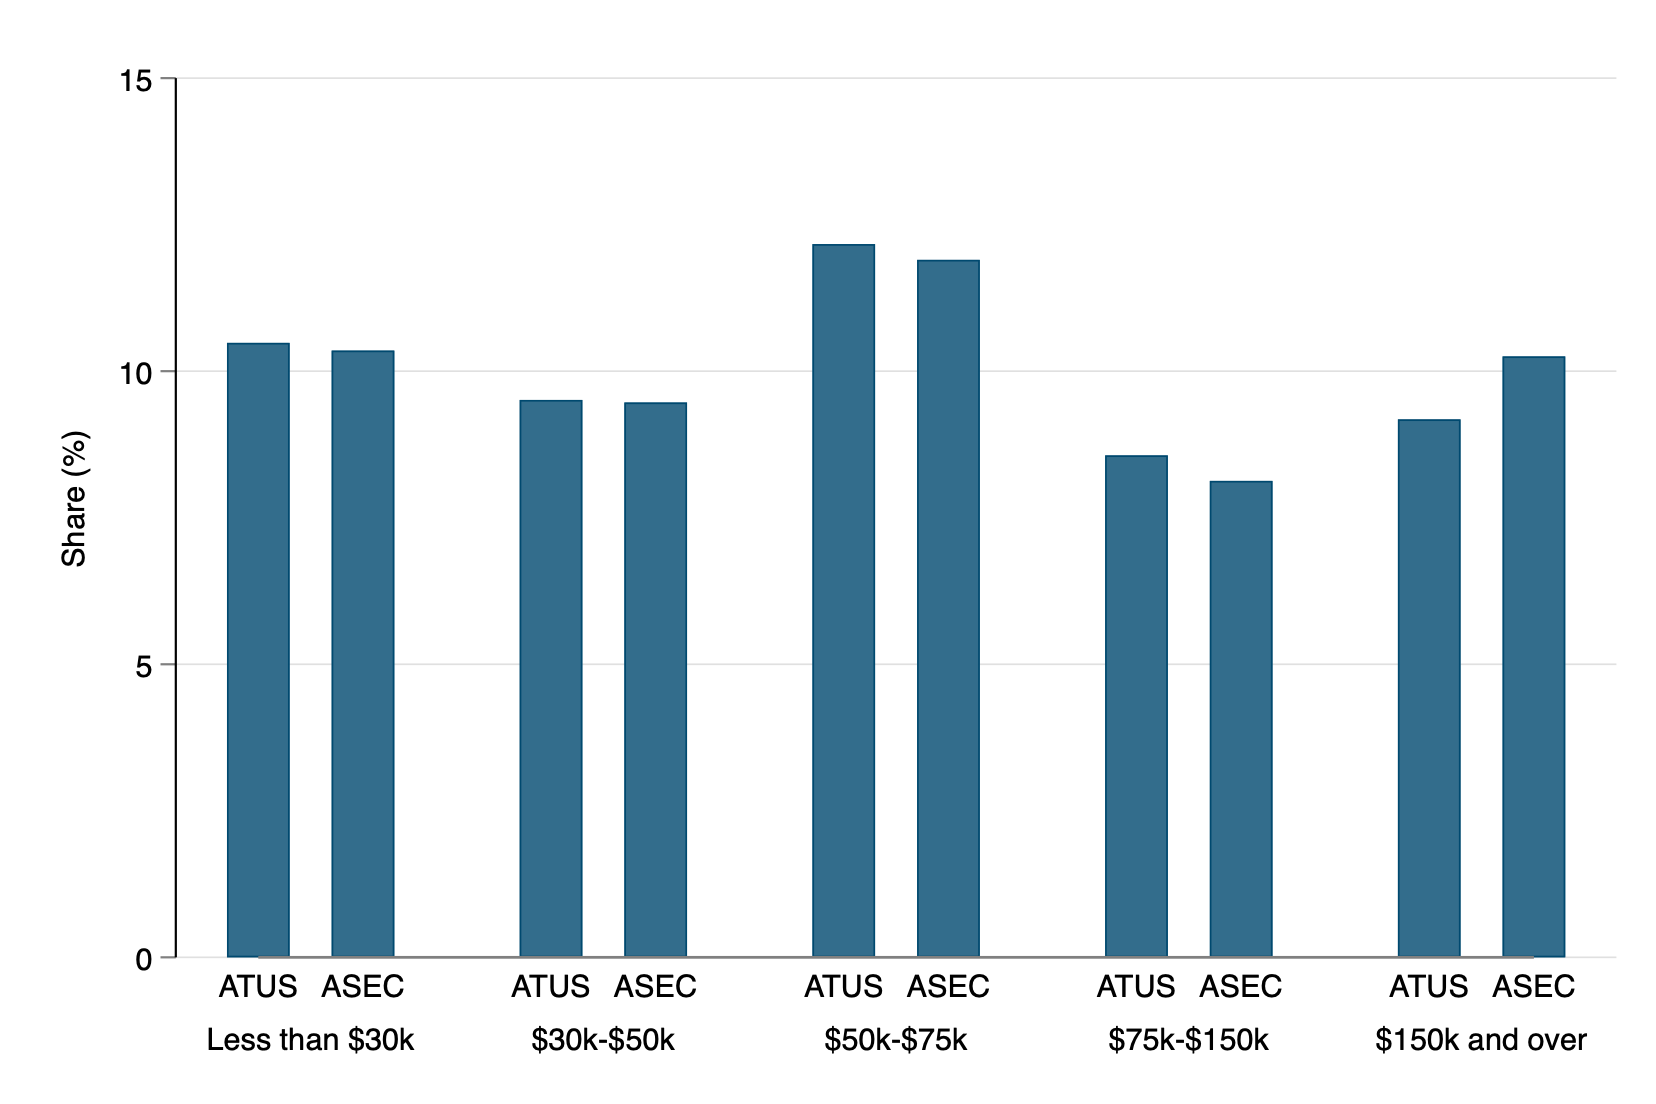
Family Income
Weekend
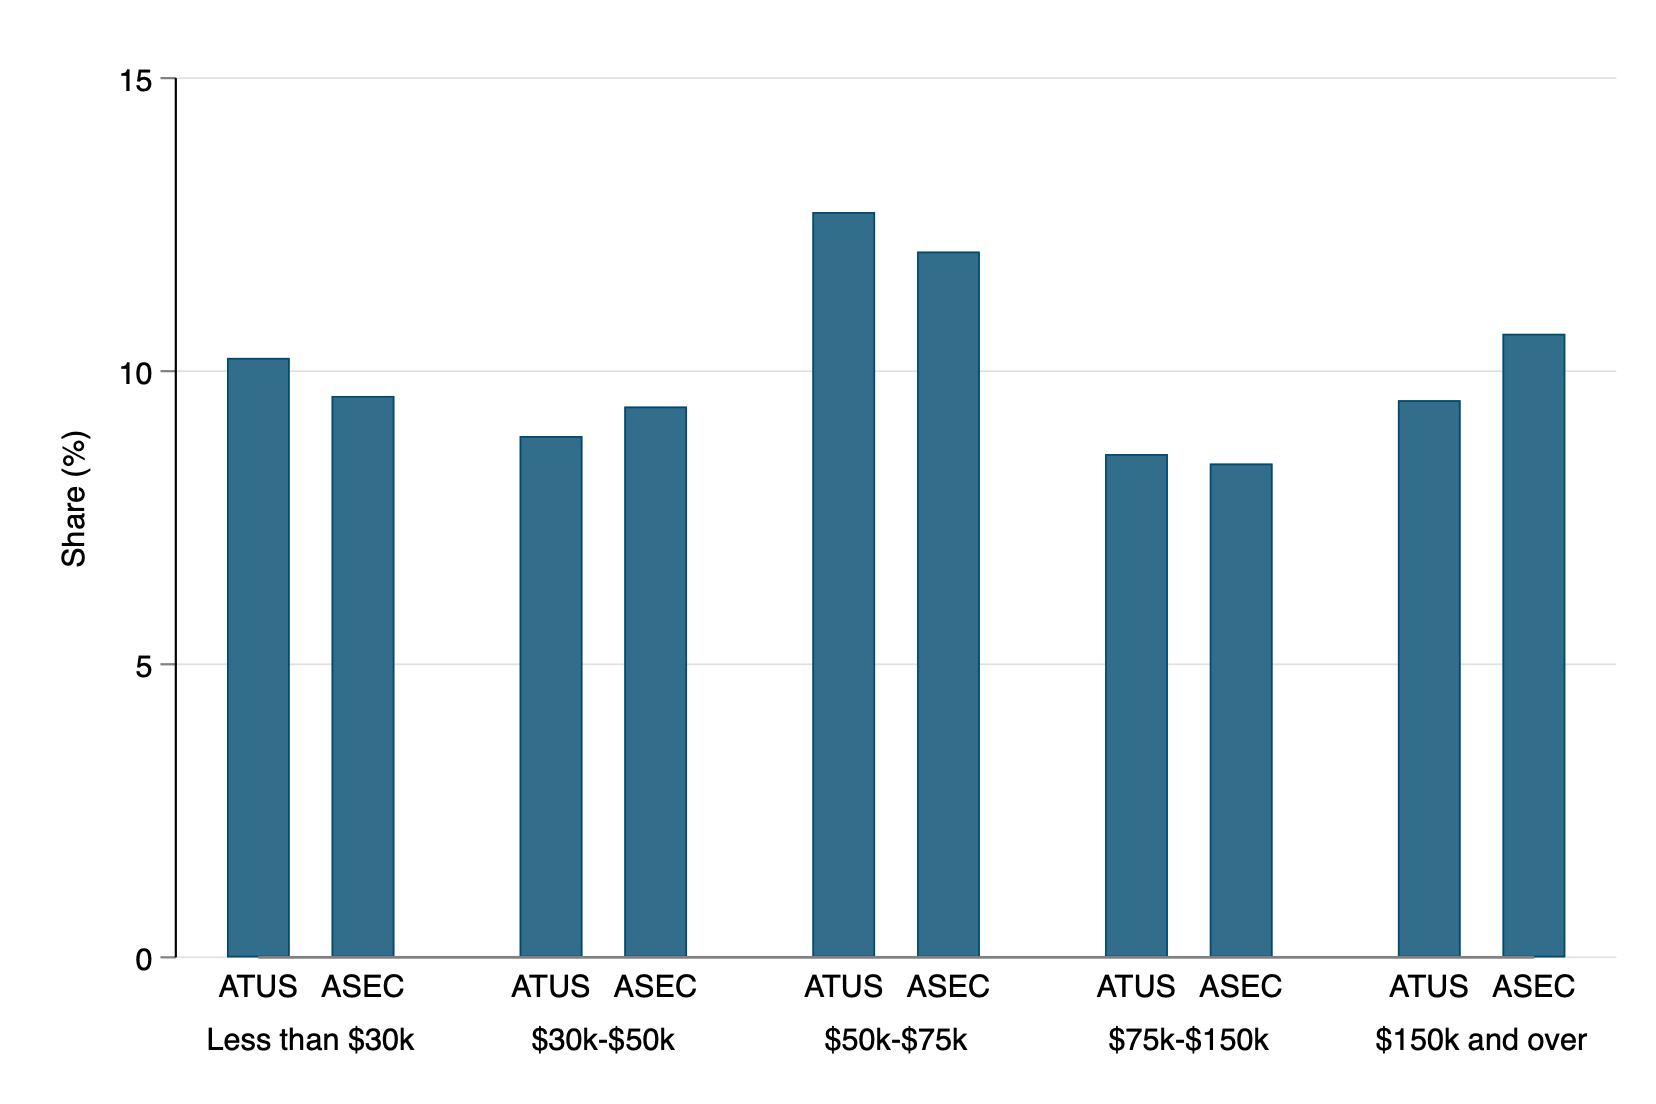
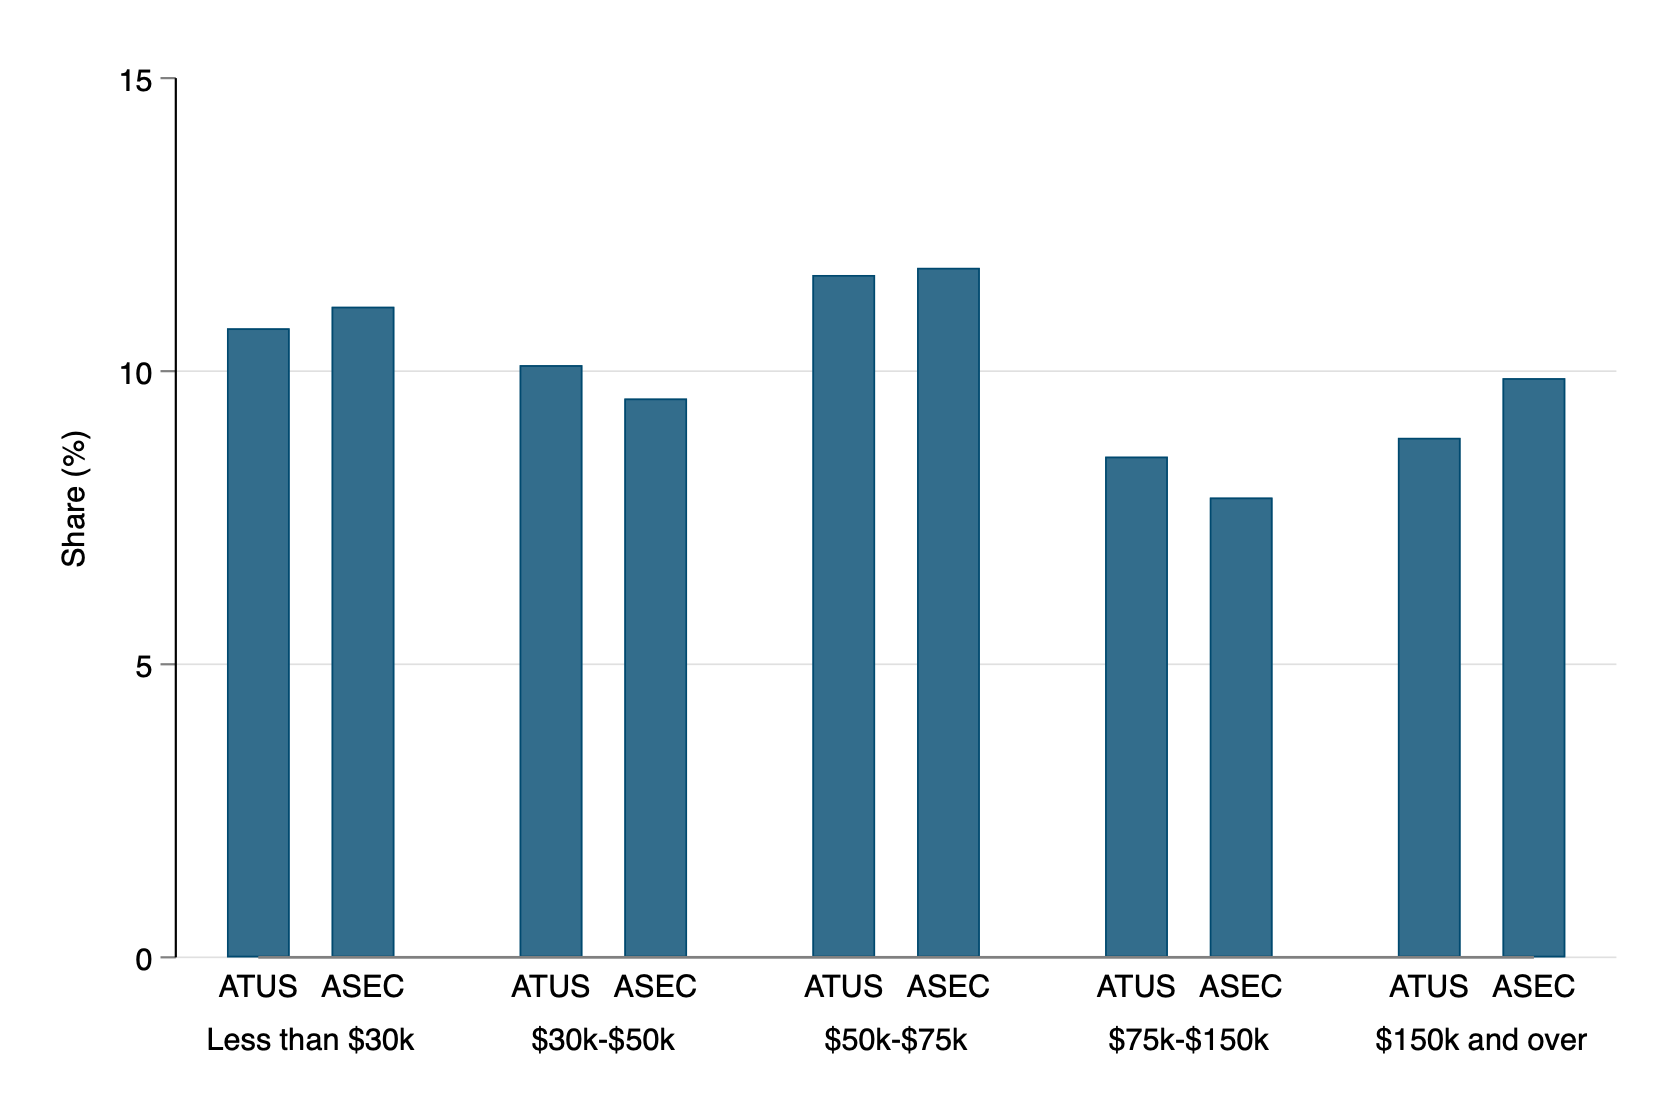
Weekday