ASEC-ATUS Match Quality Statistics
Year 2010
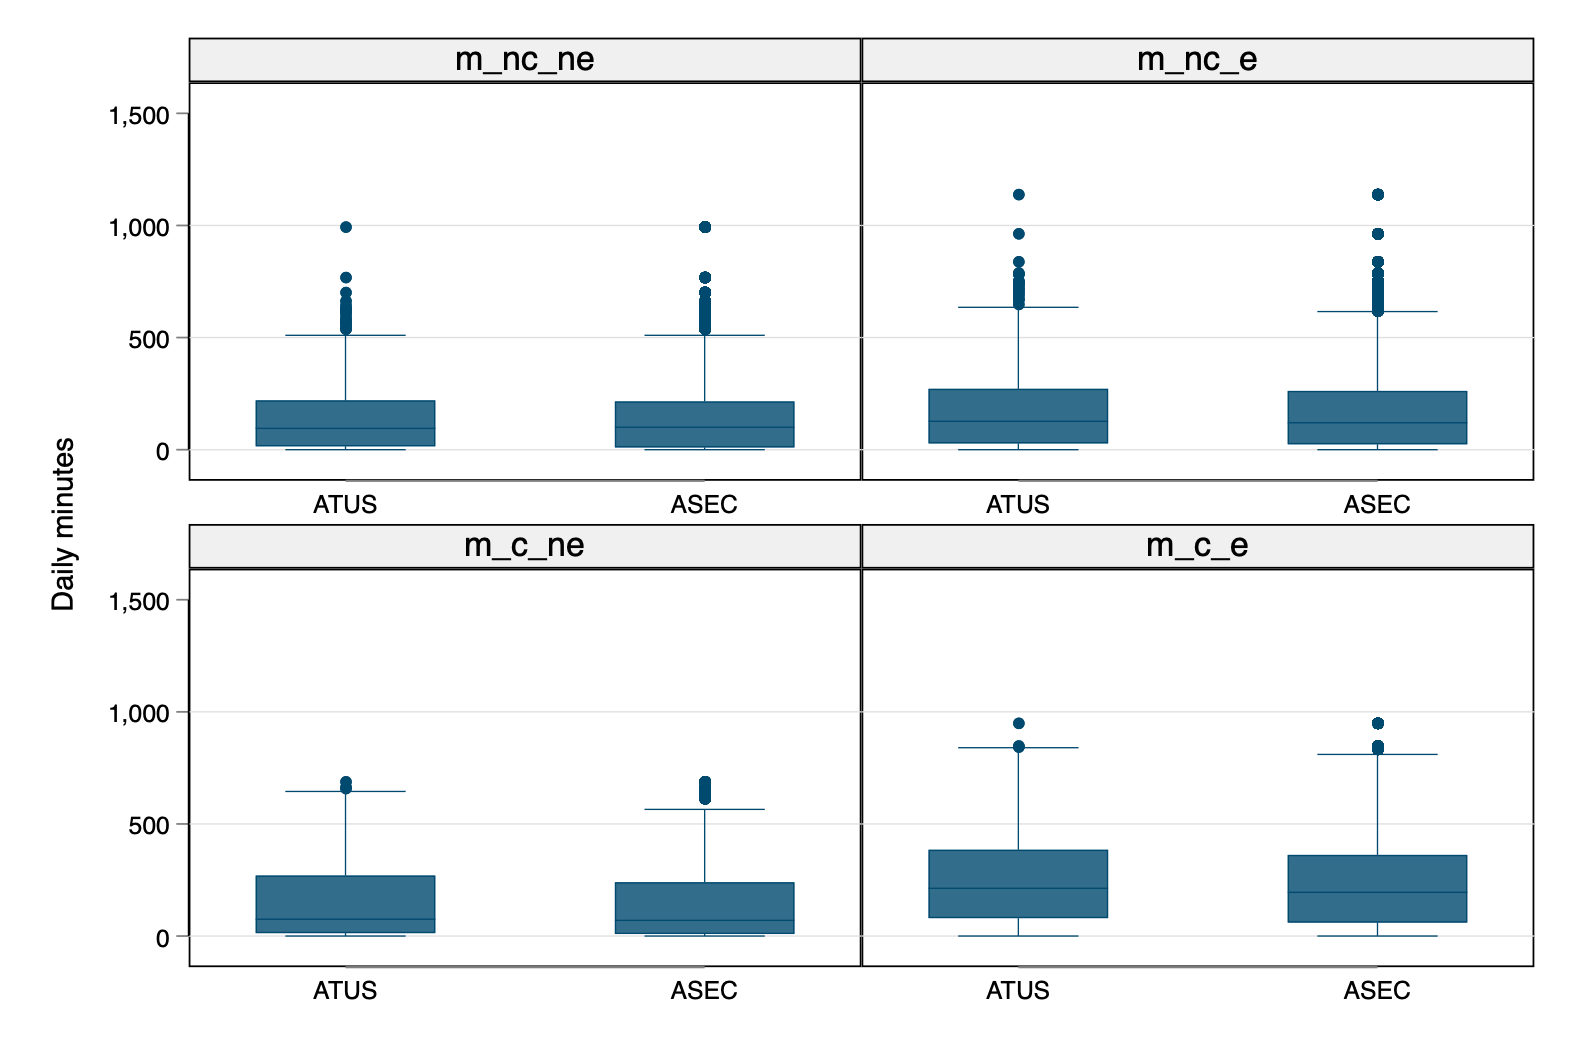
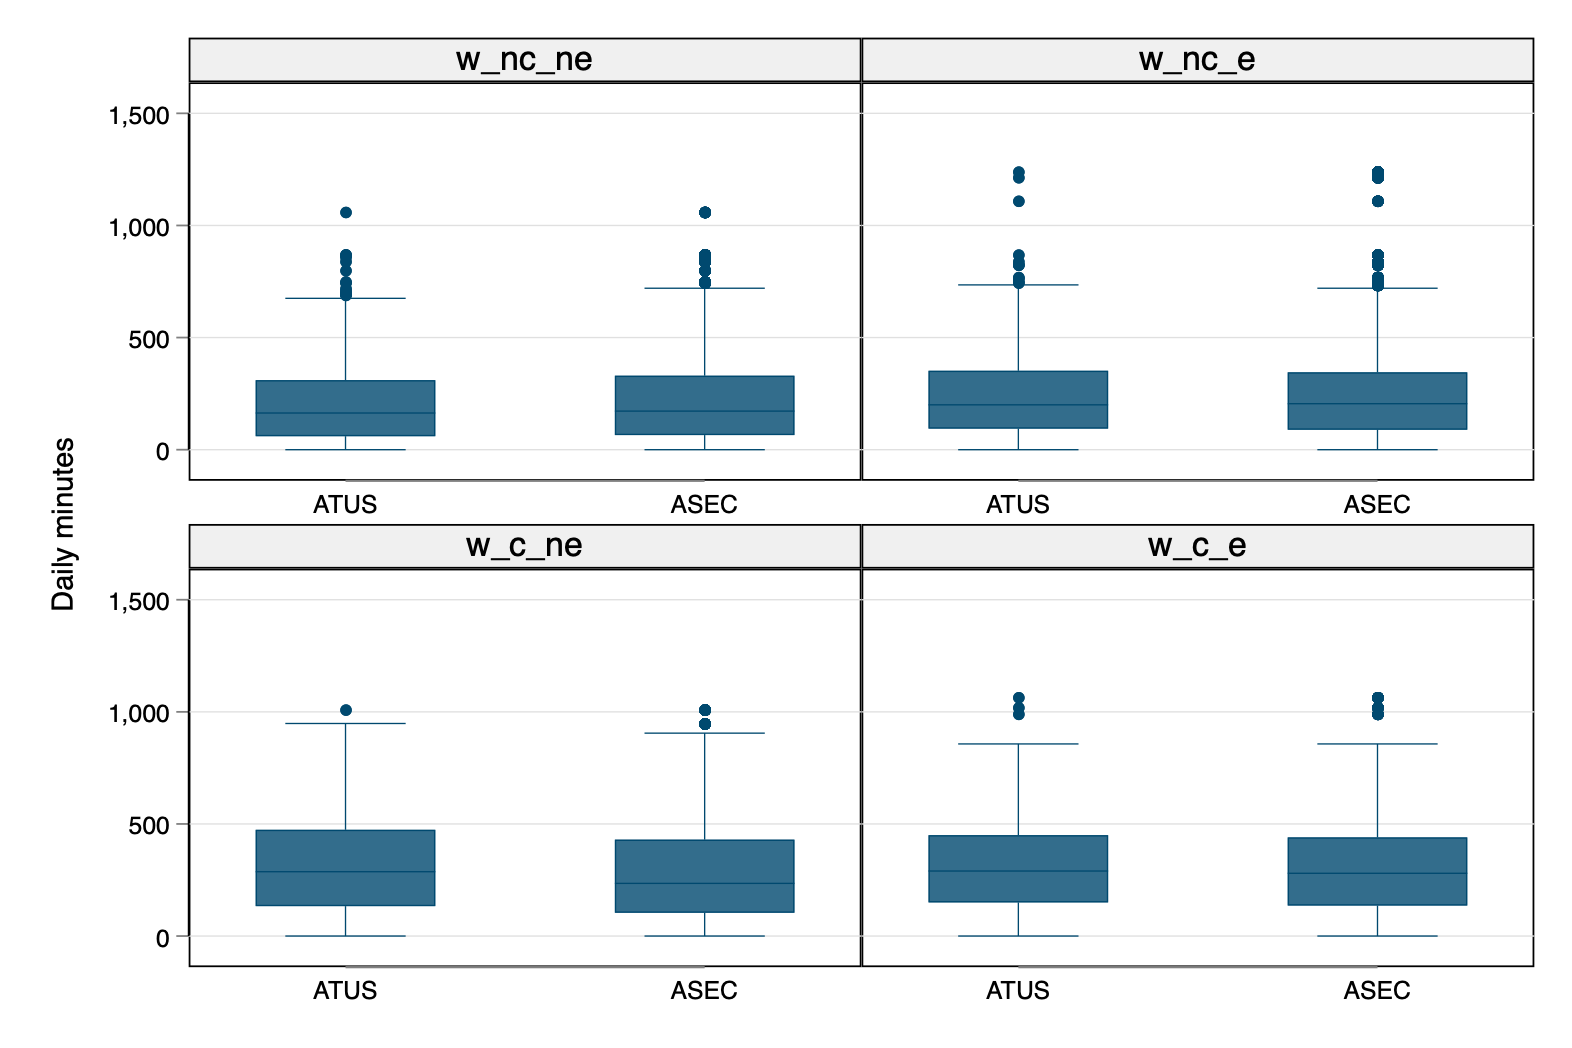
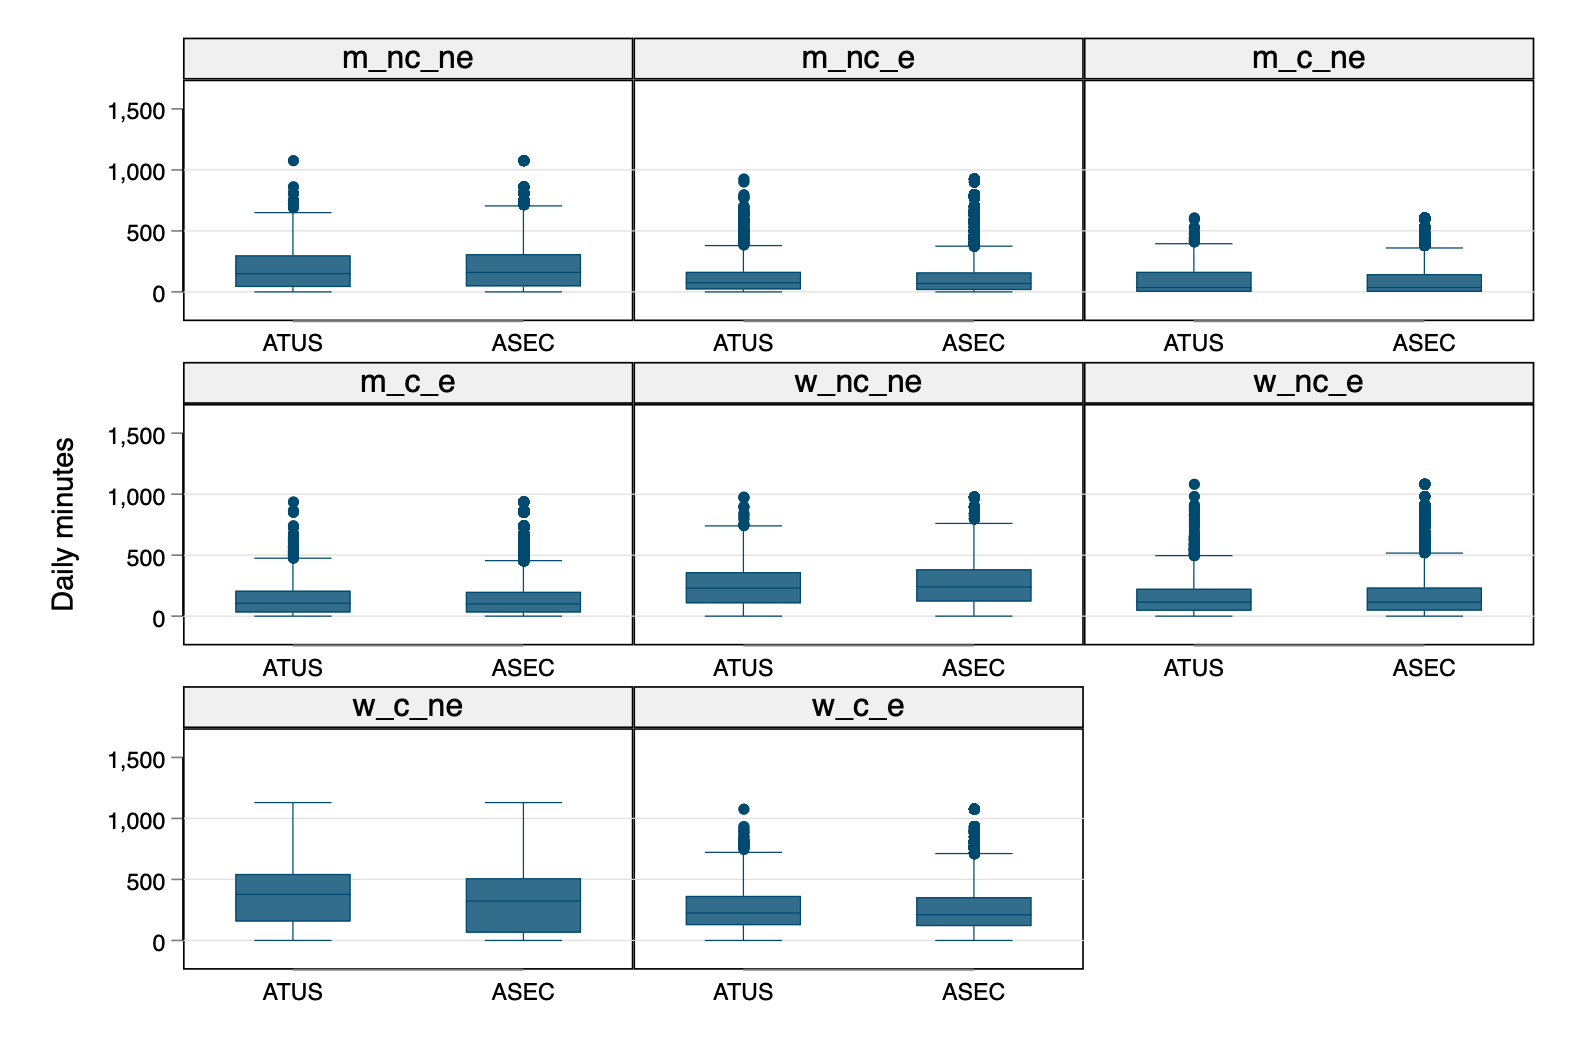
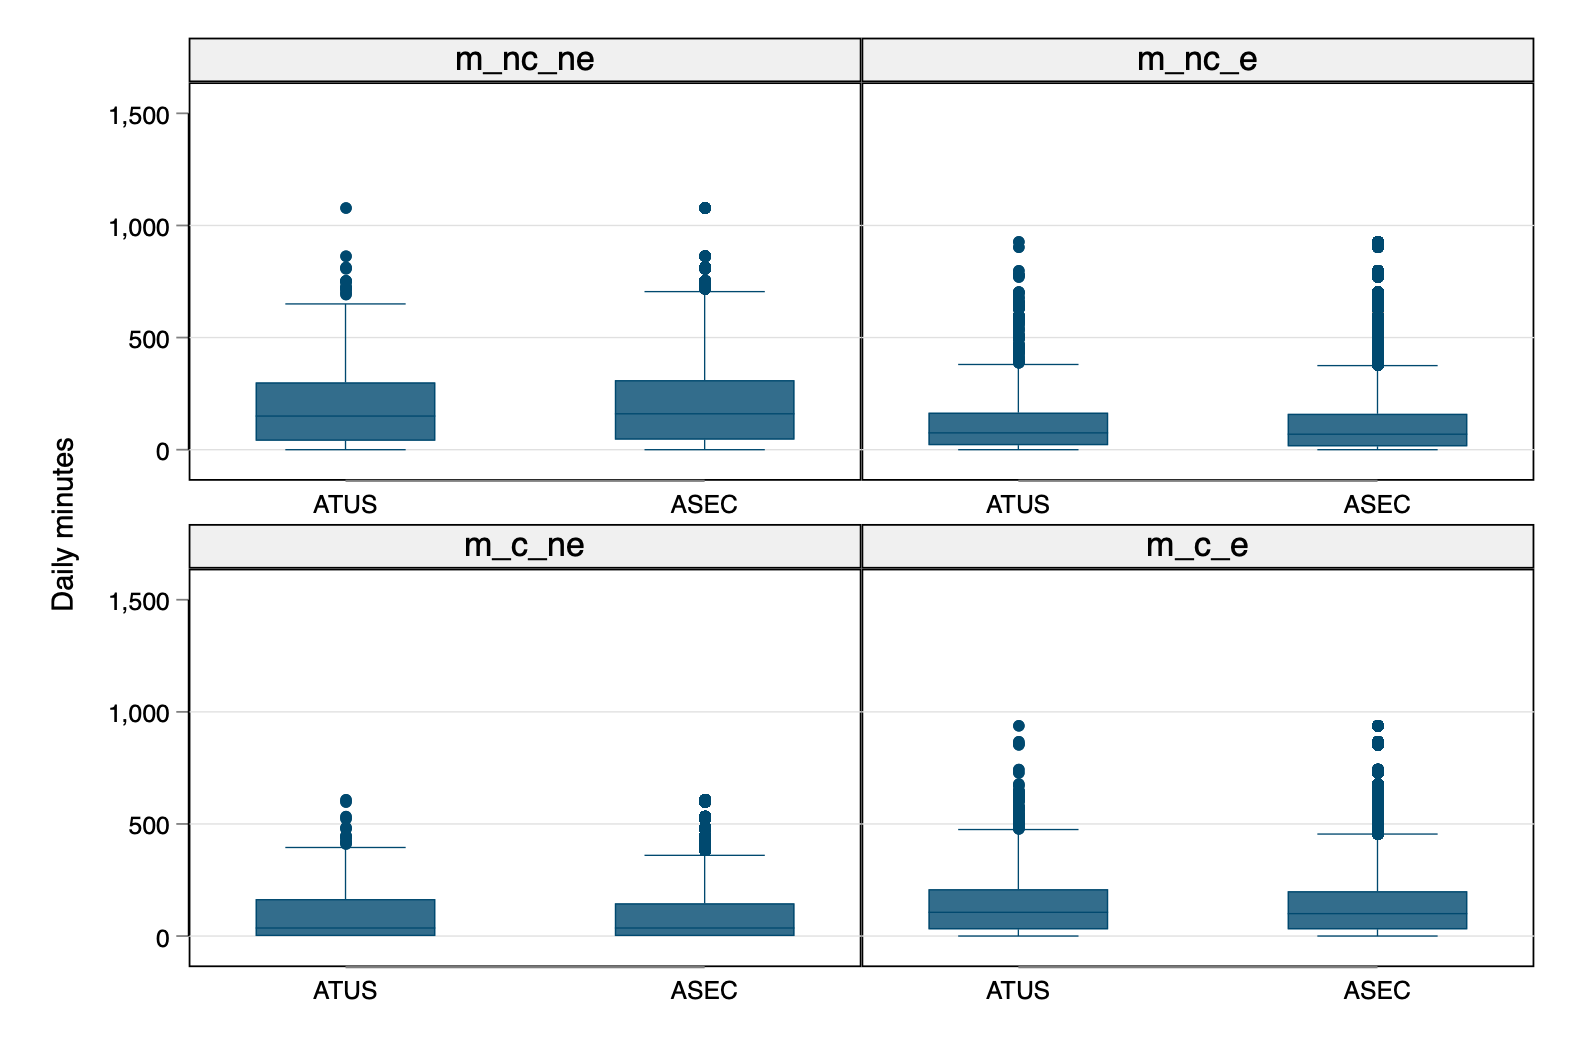
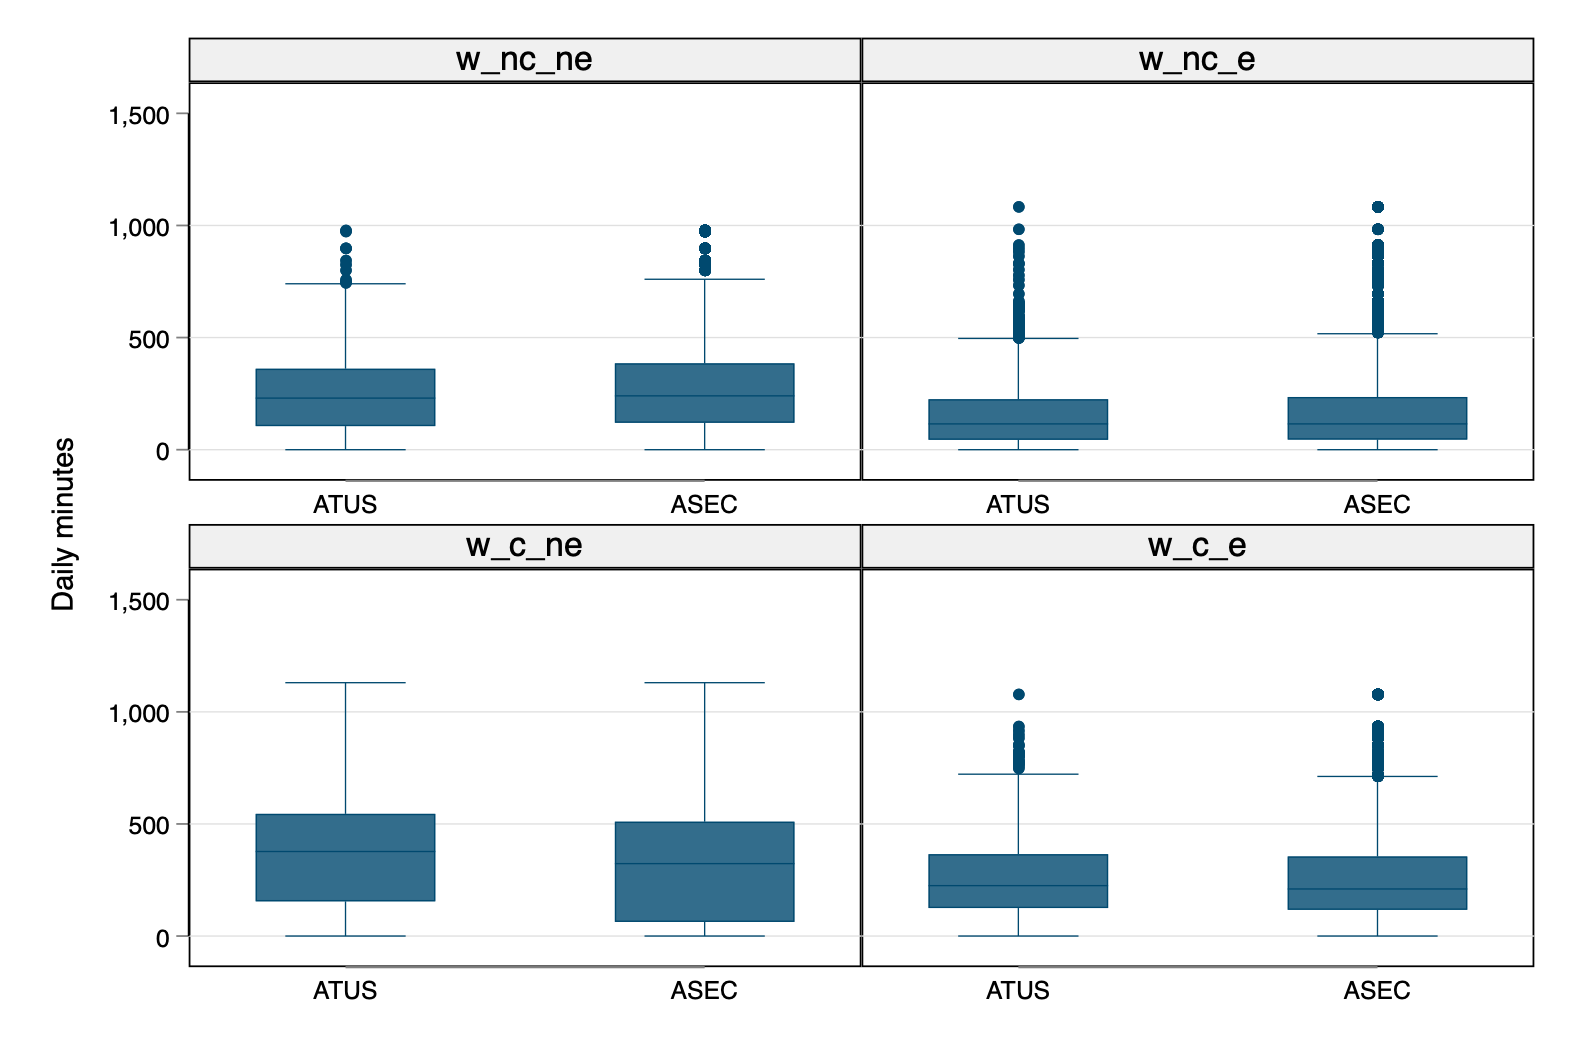
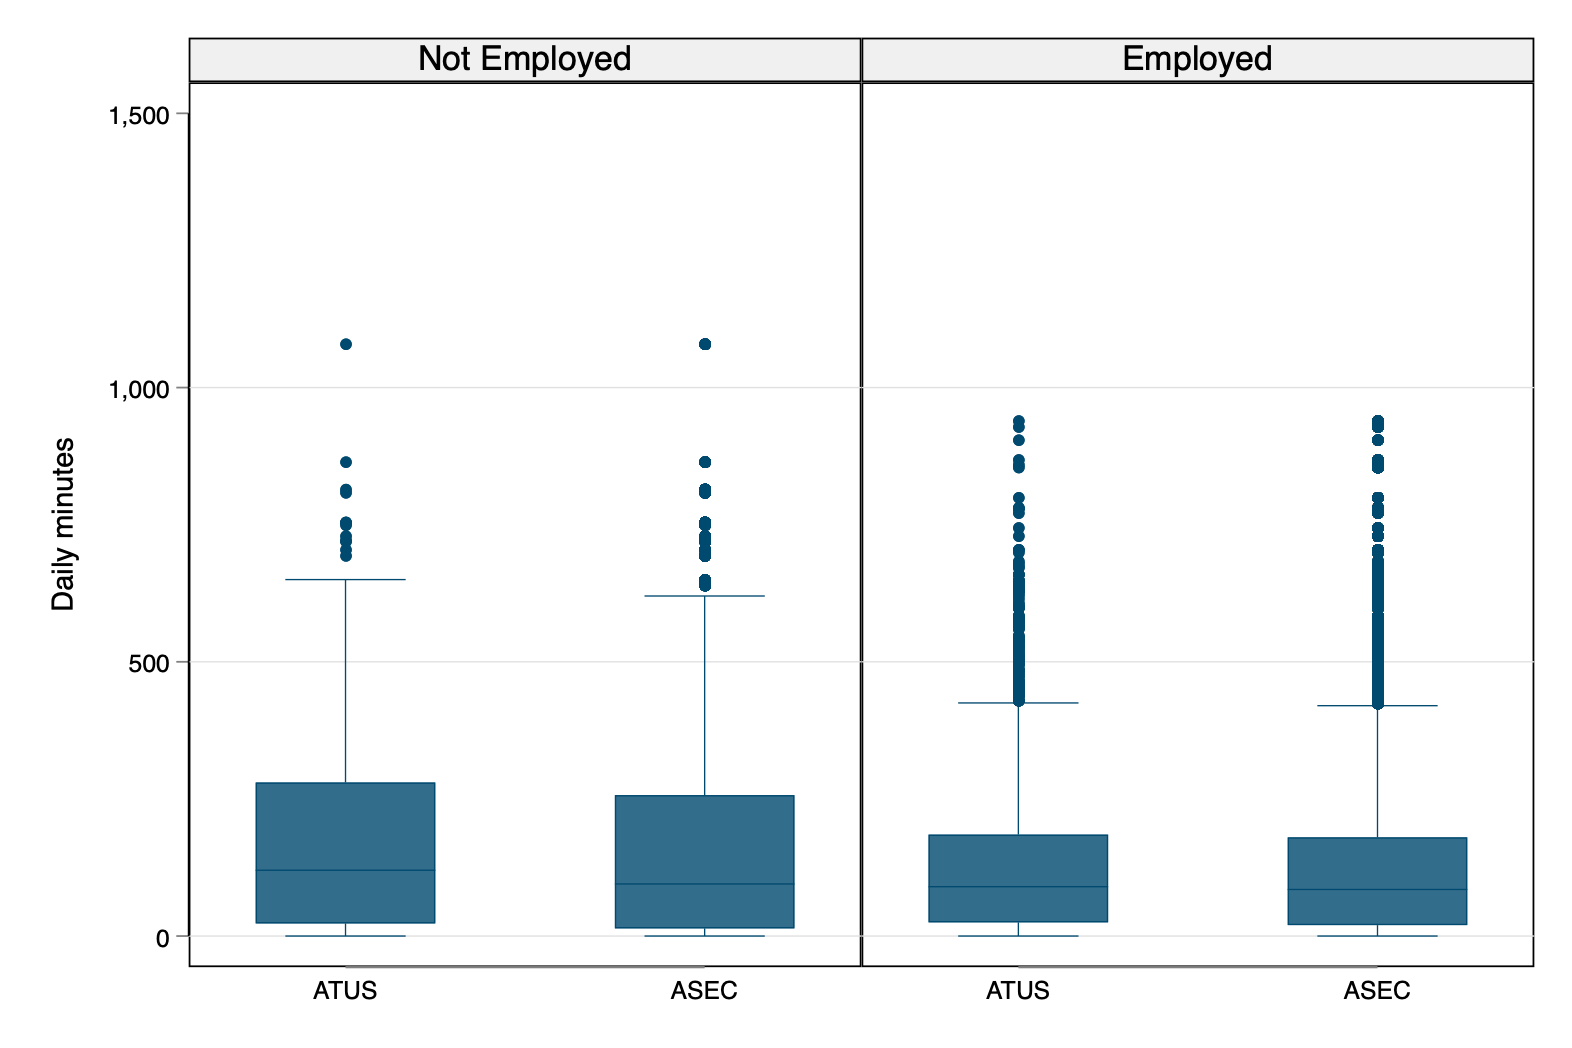
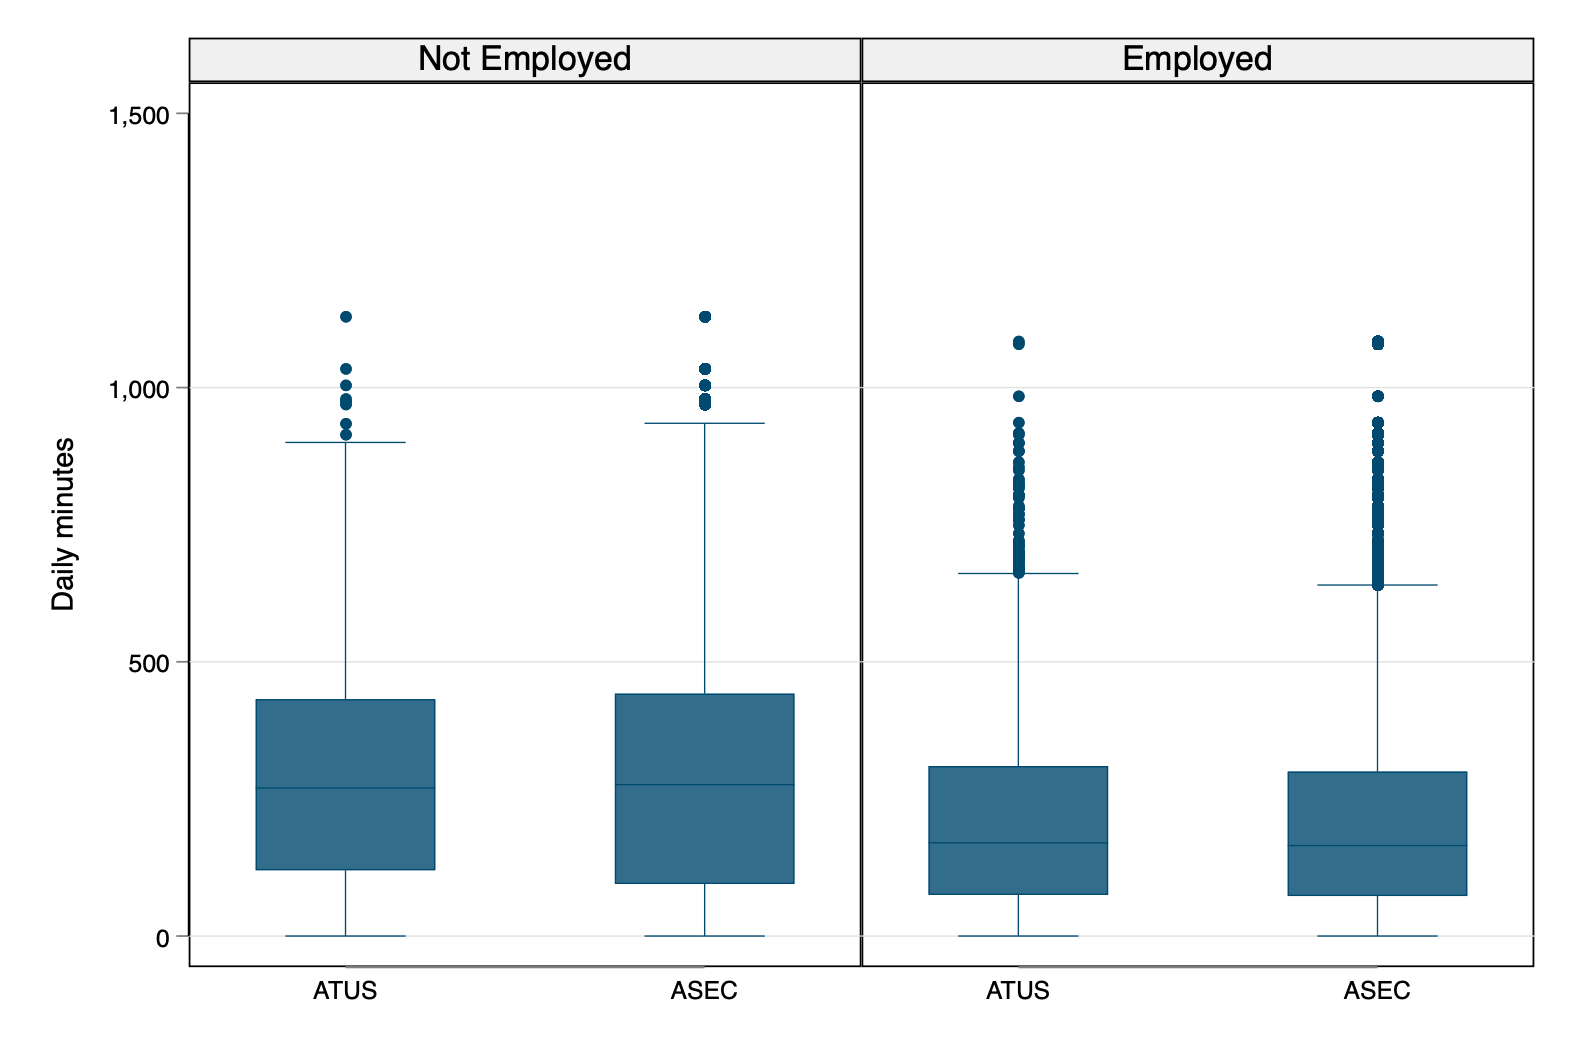
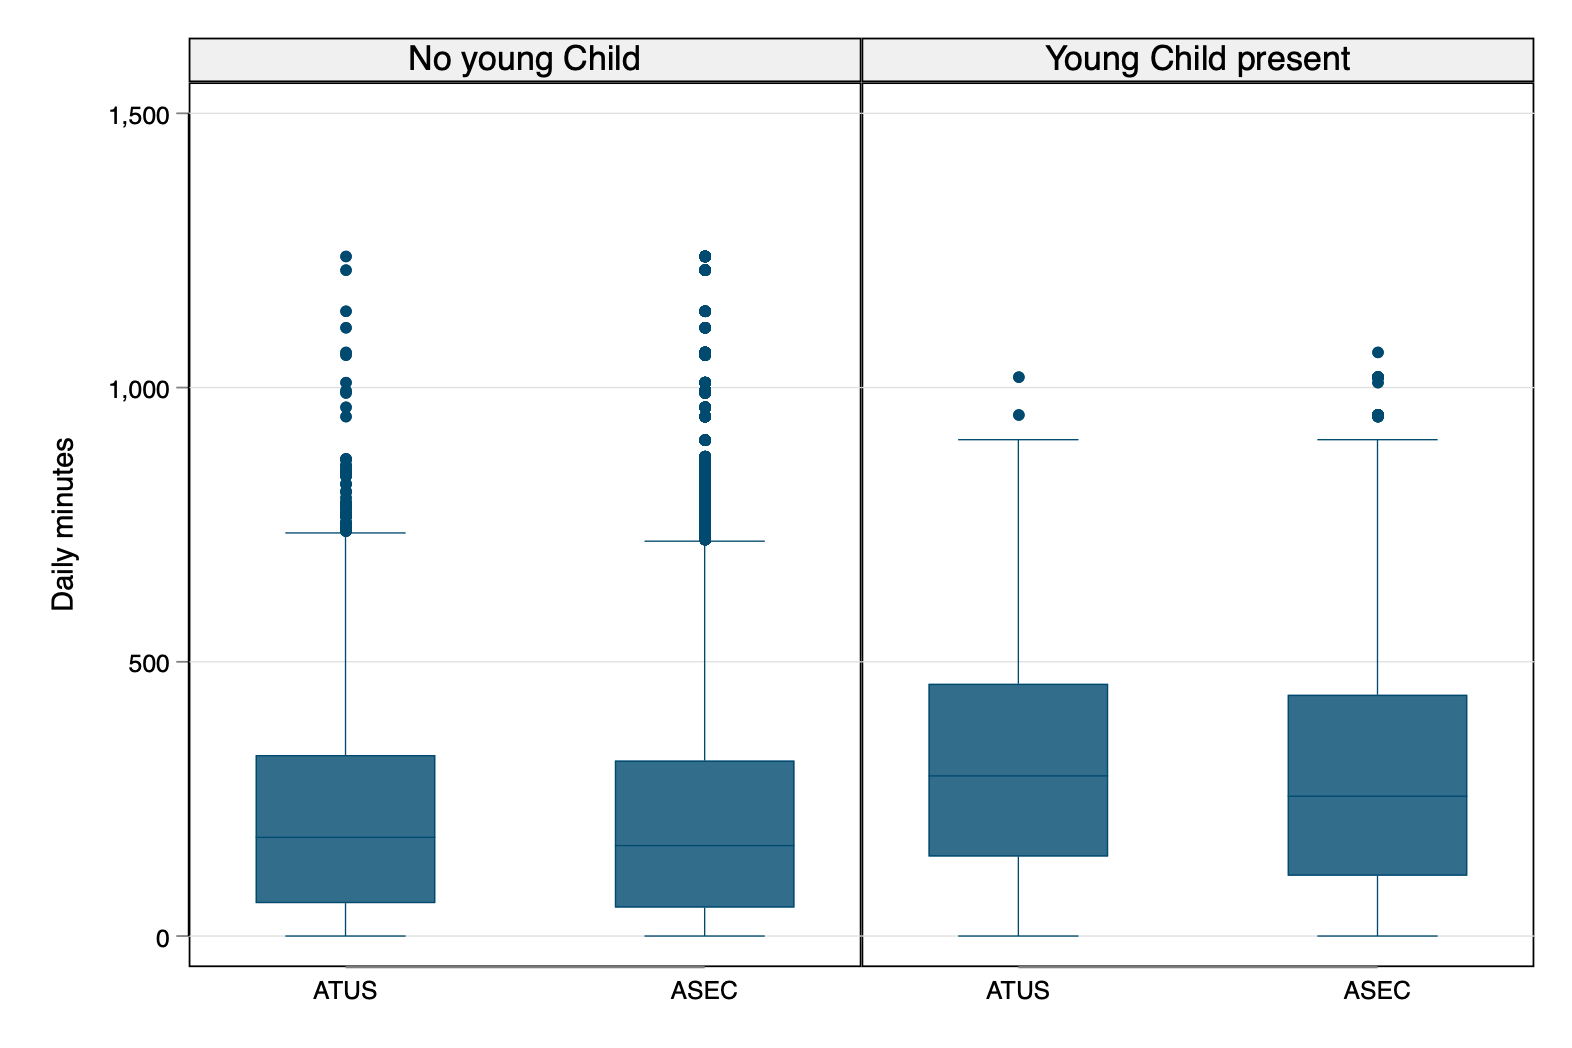
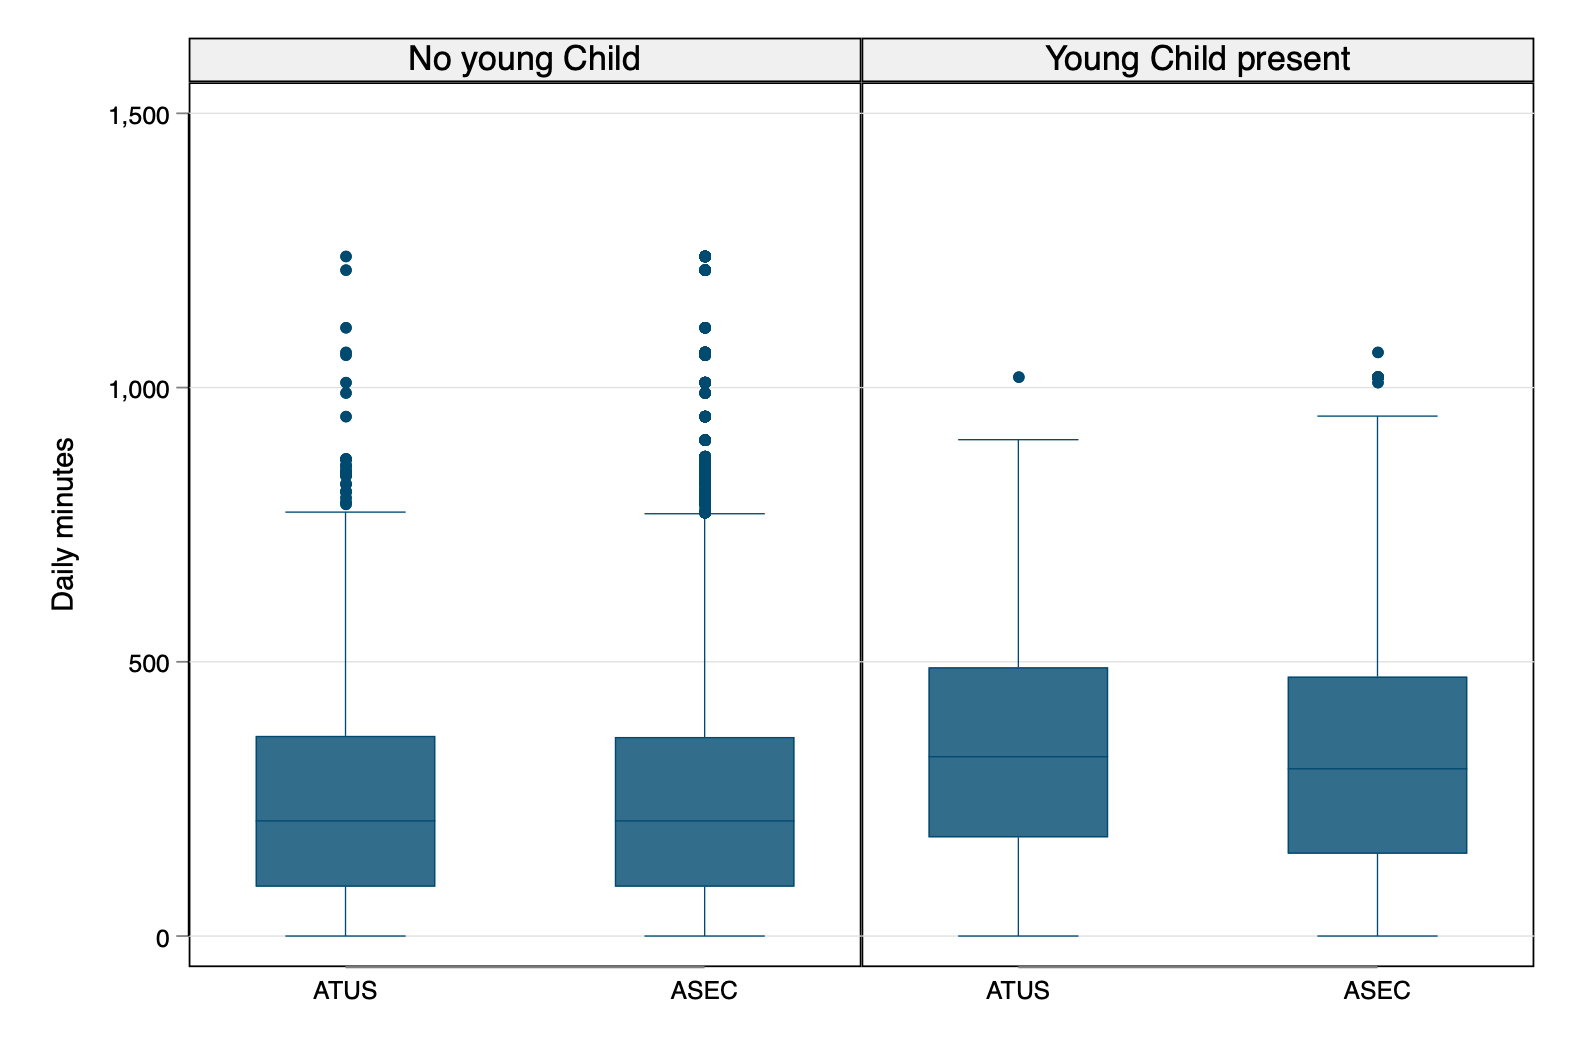
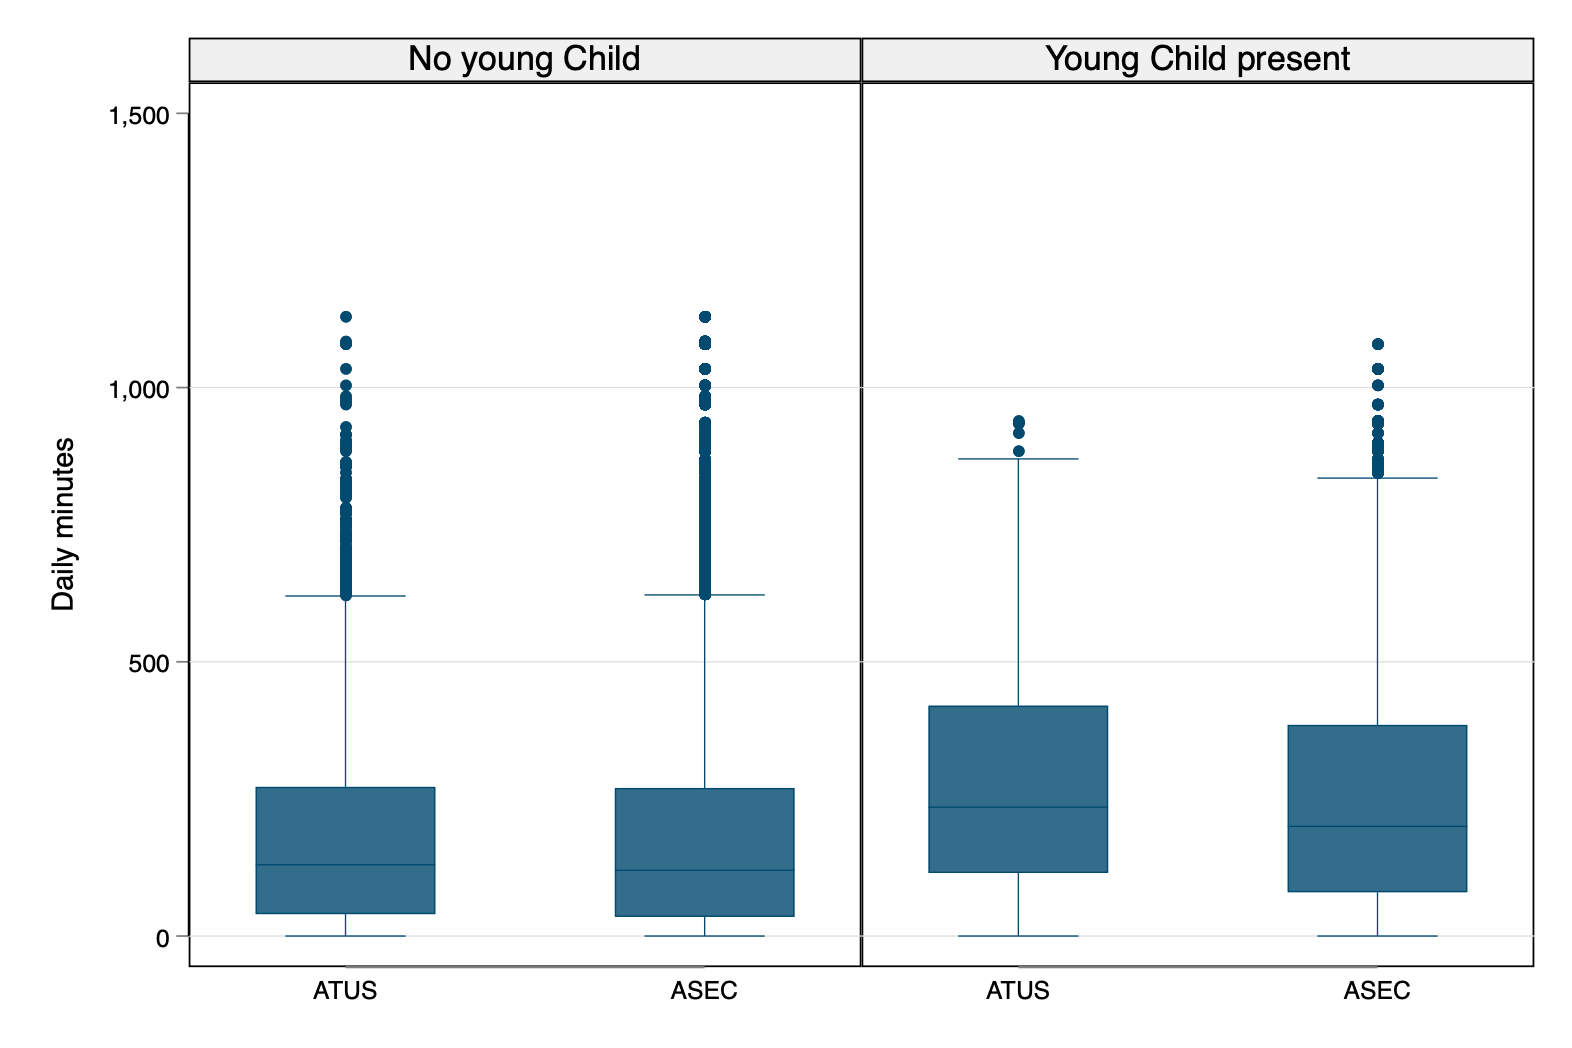
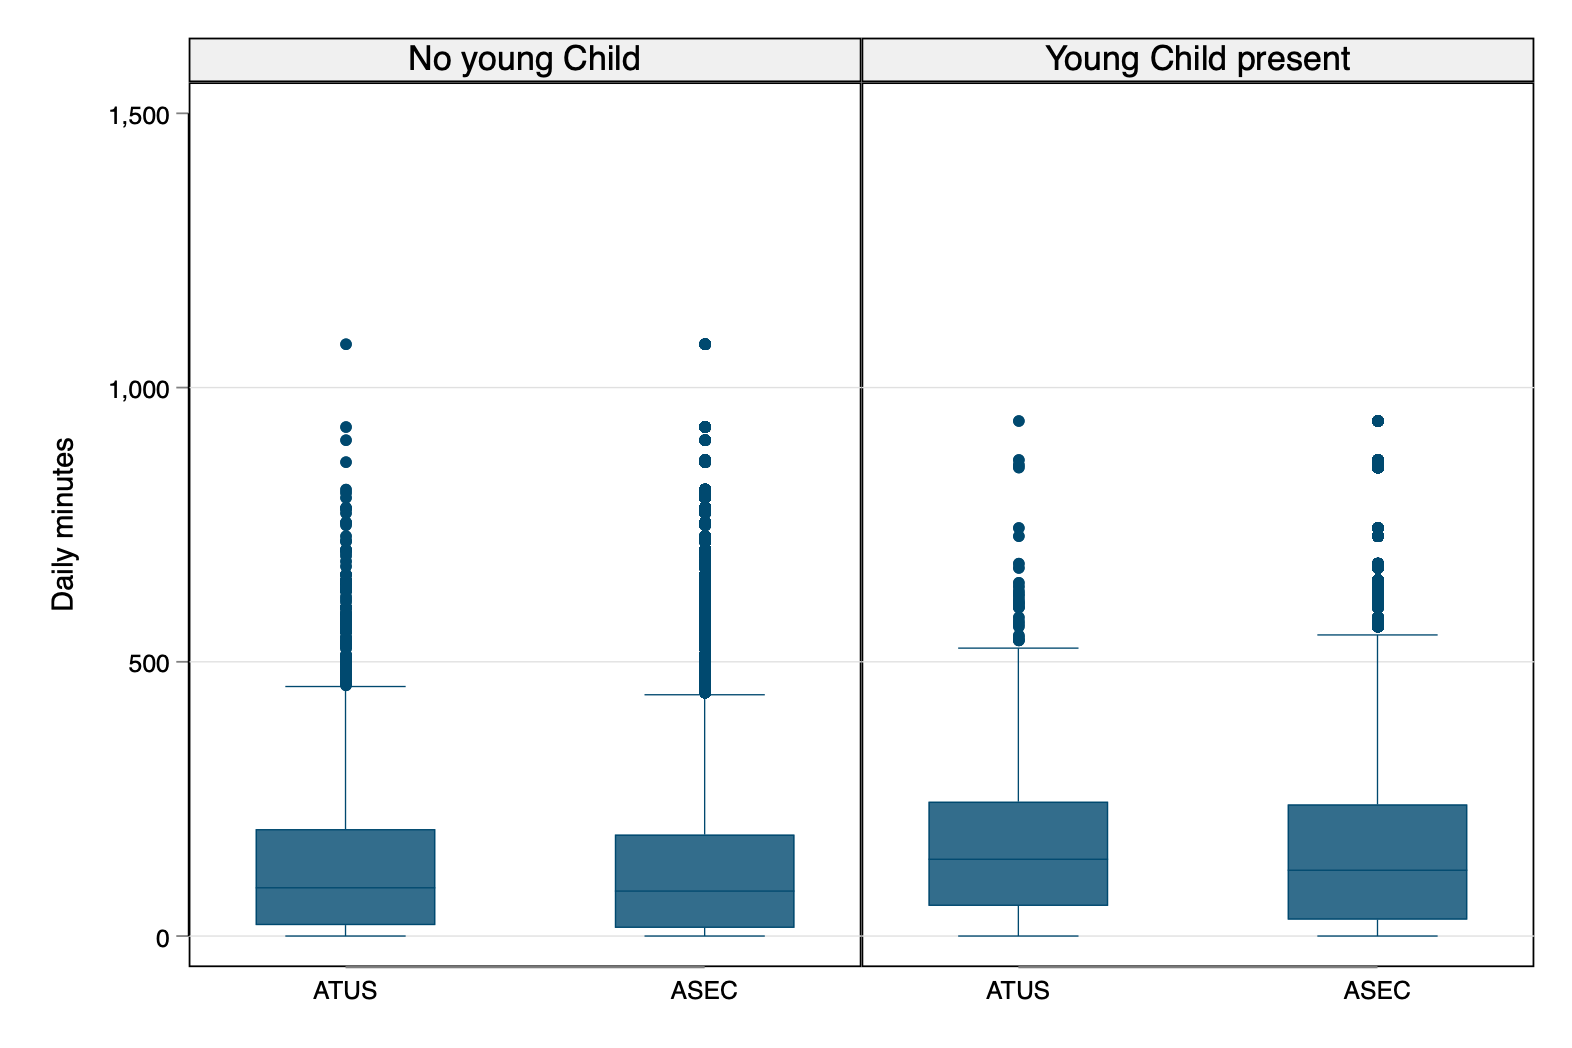
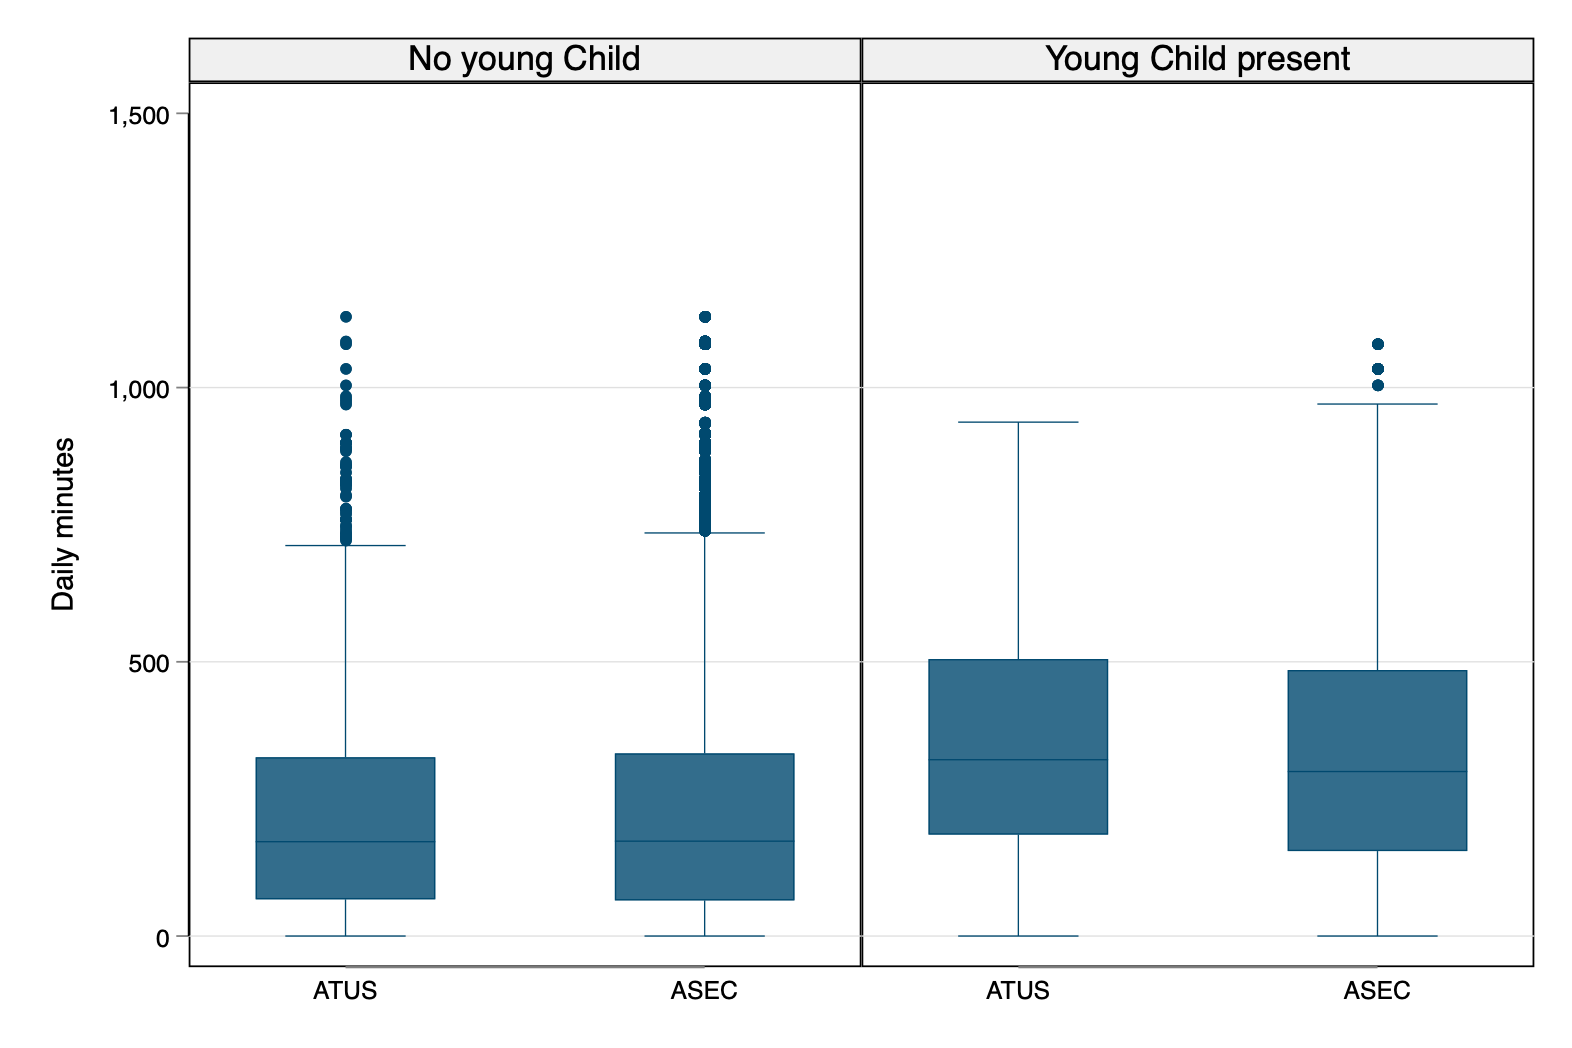
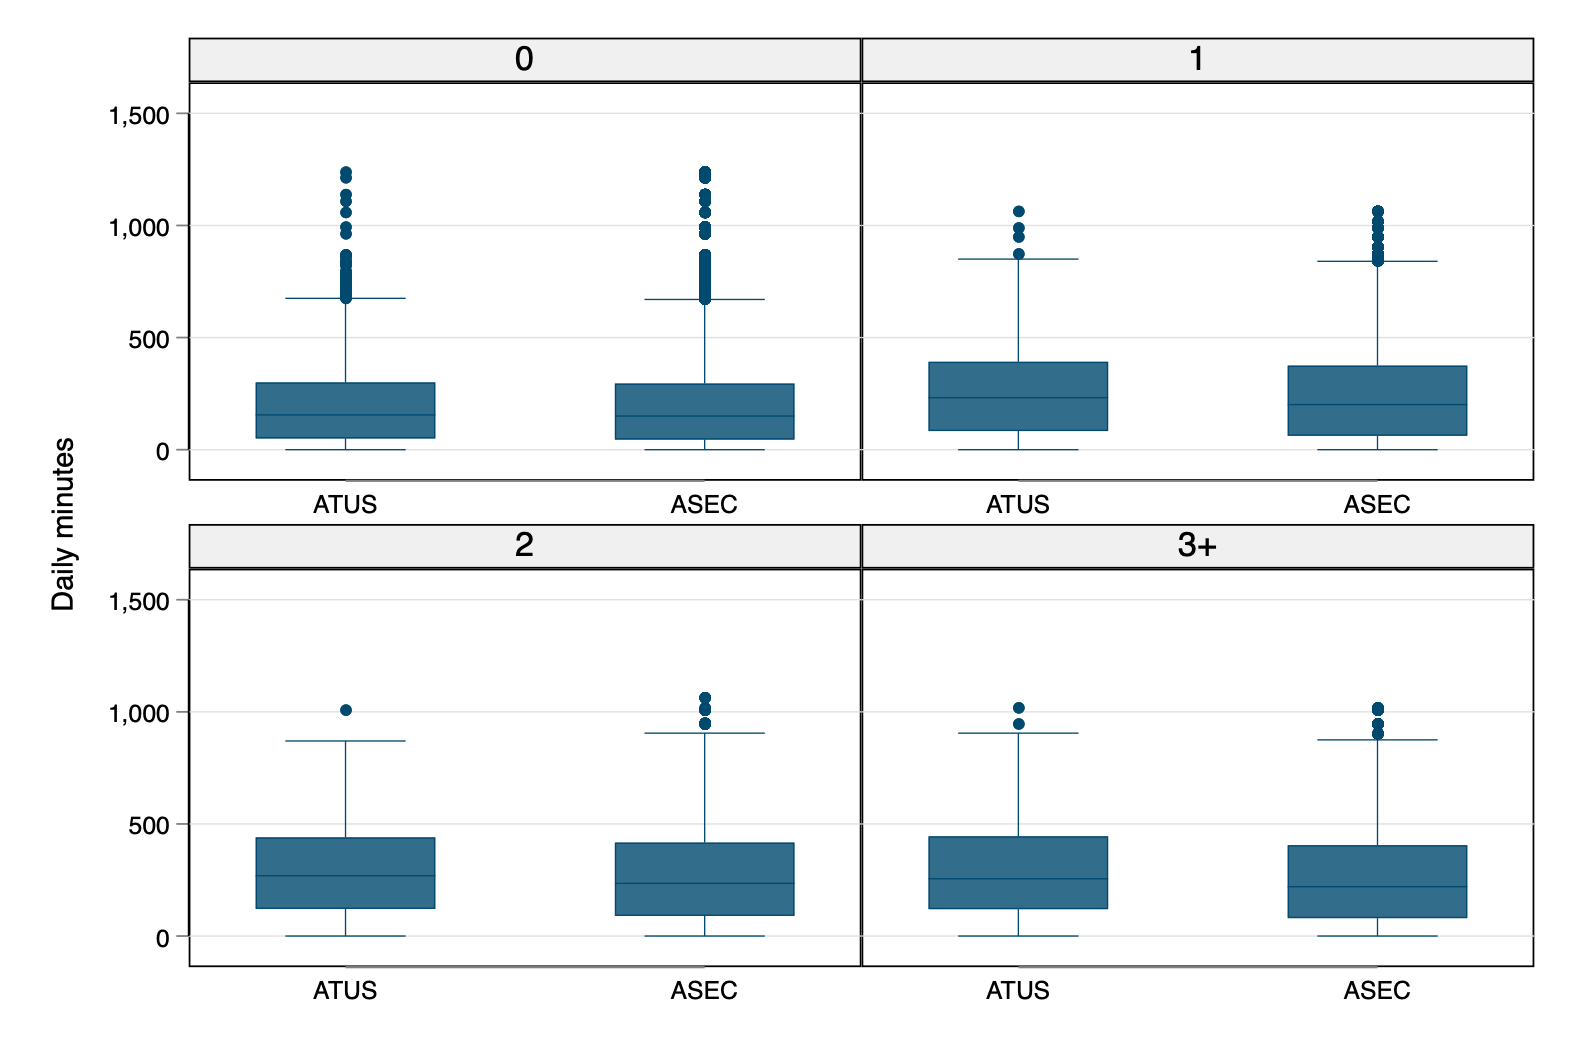
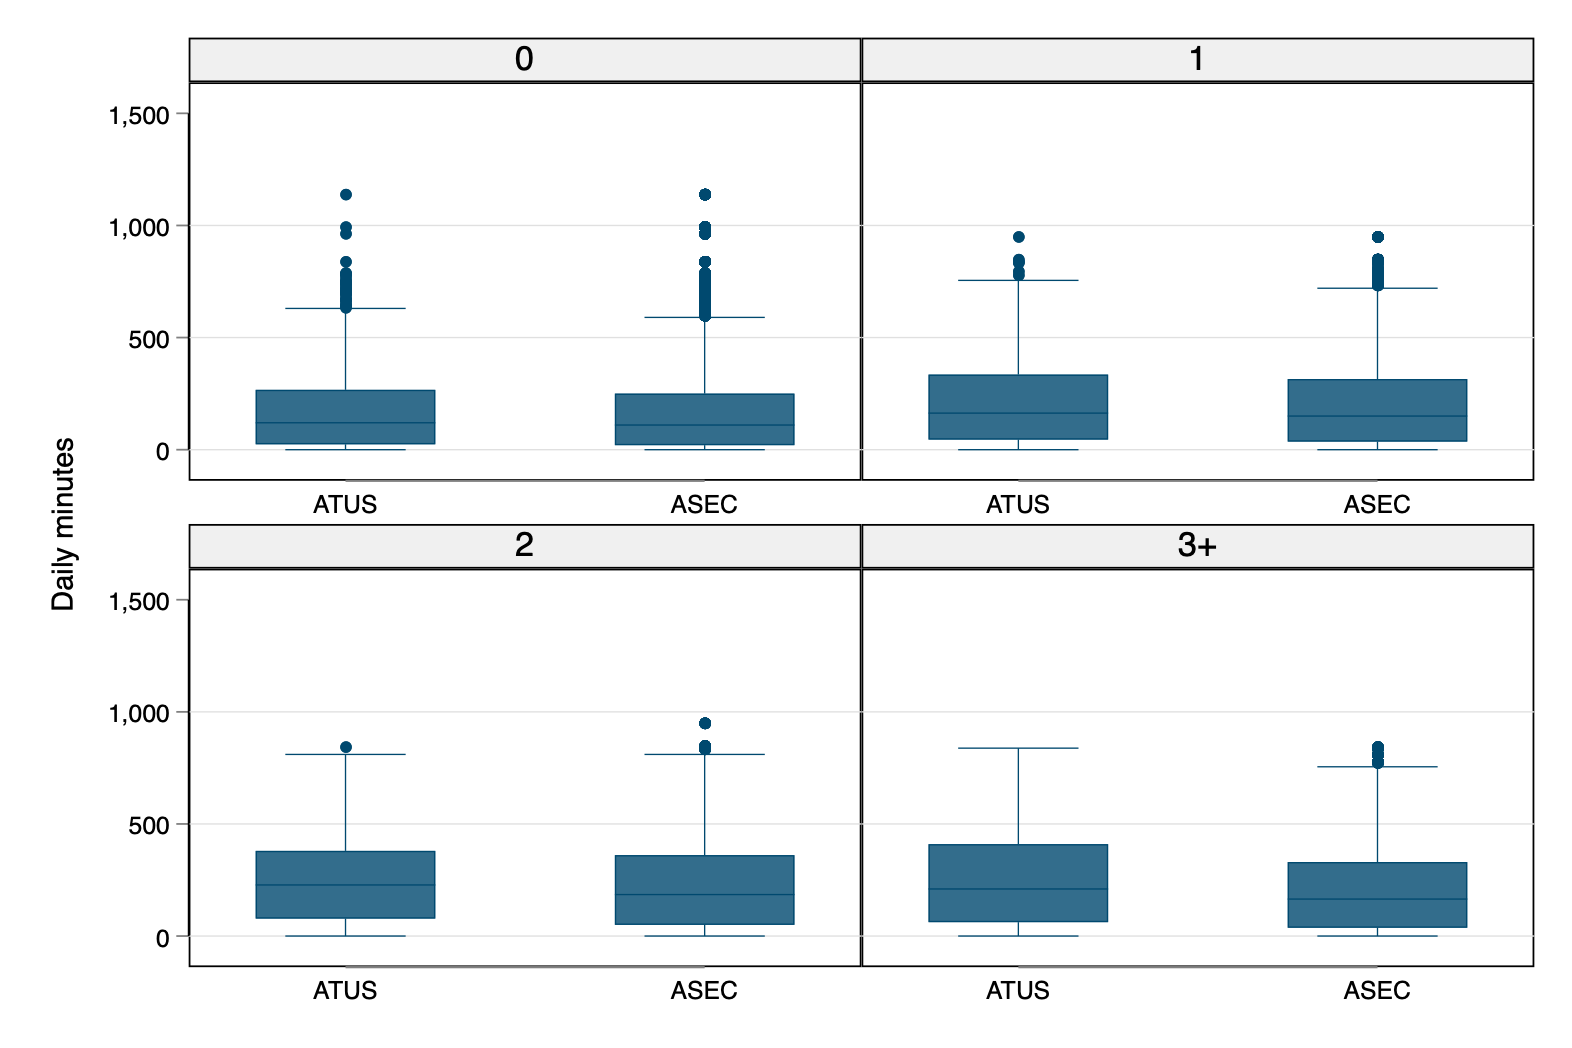
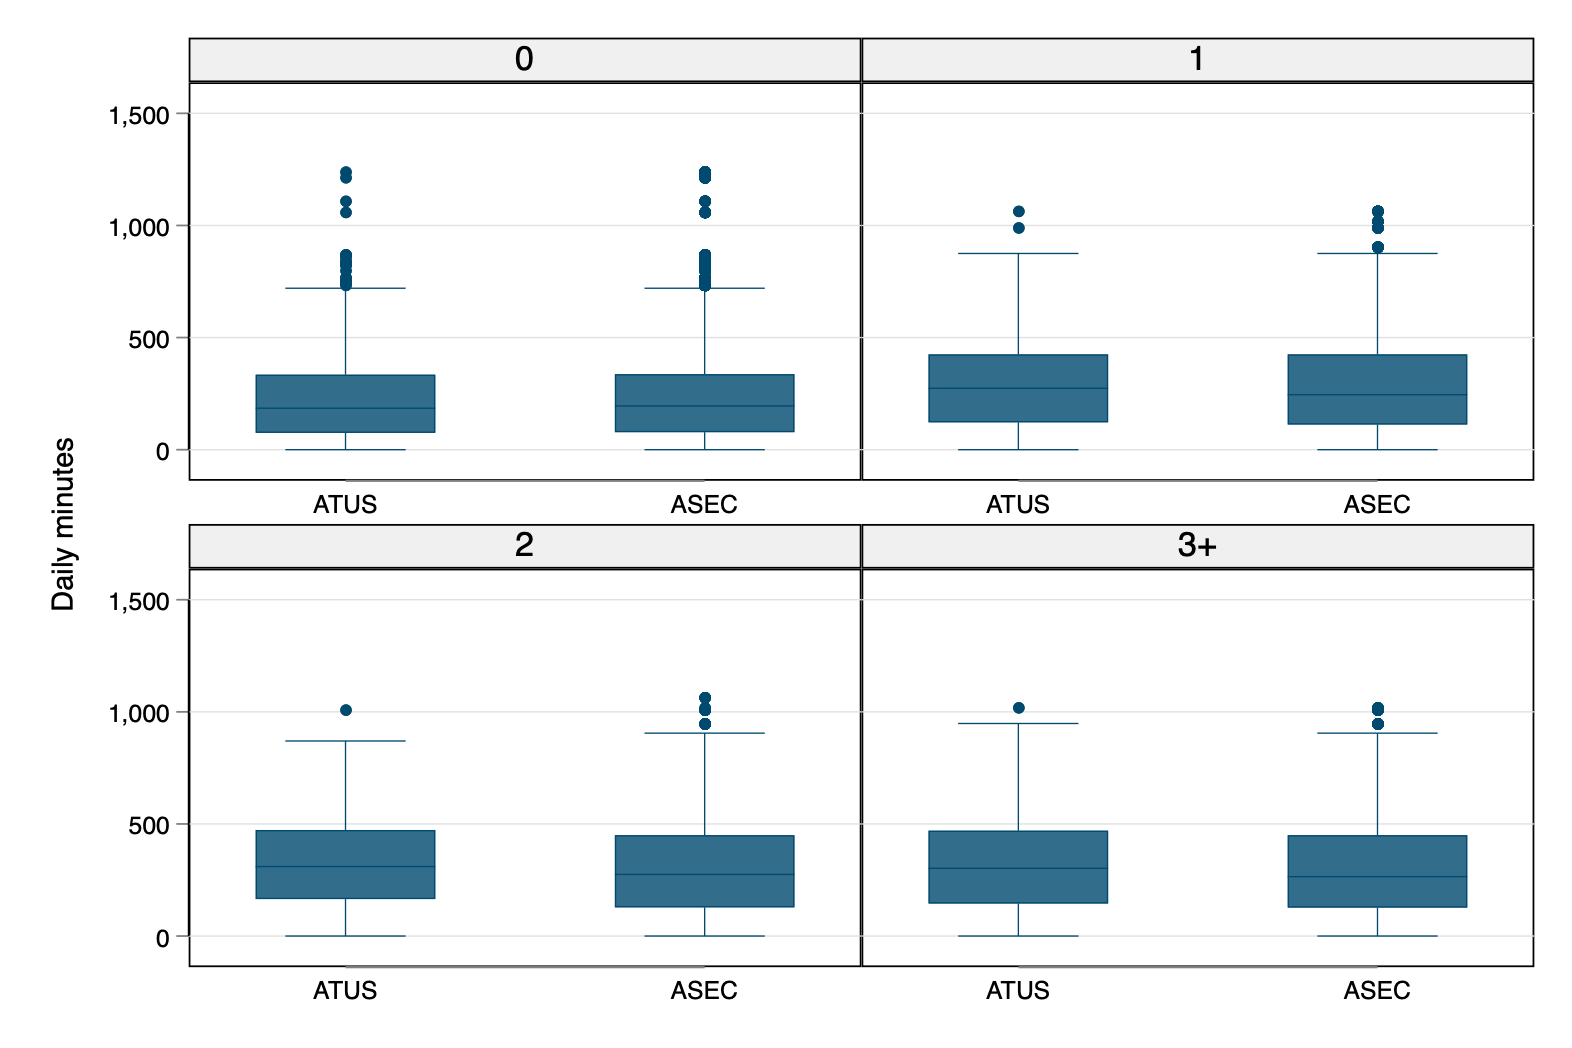
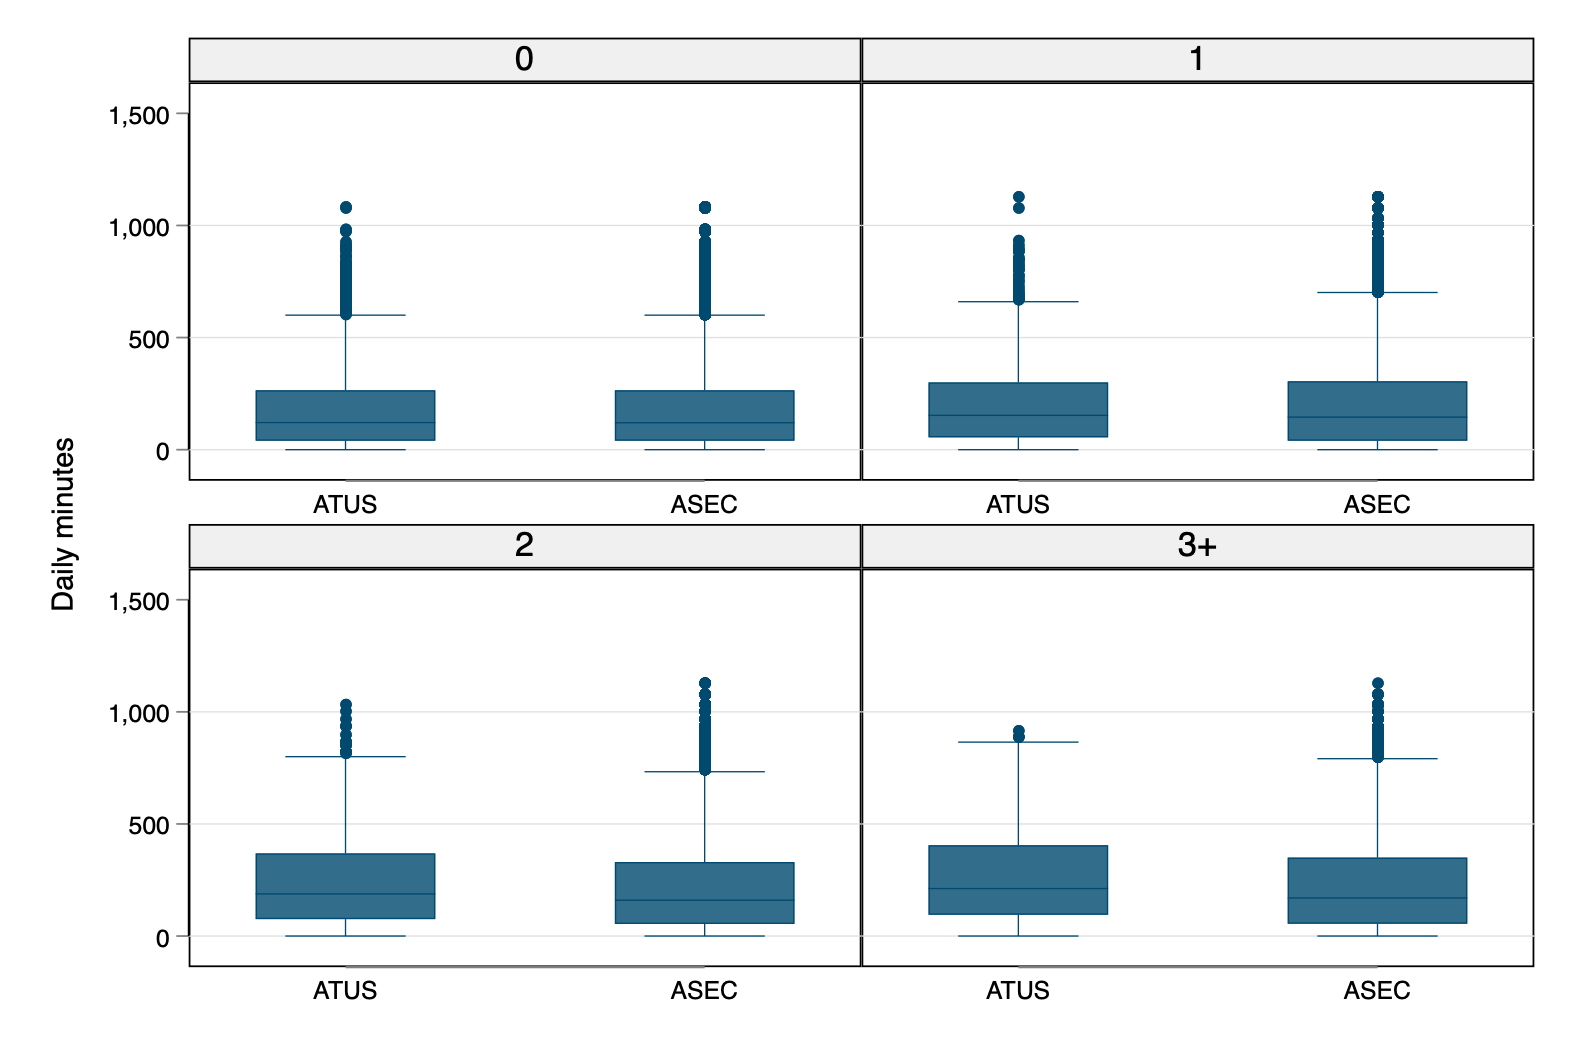
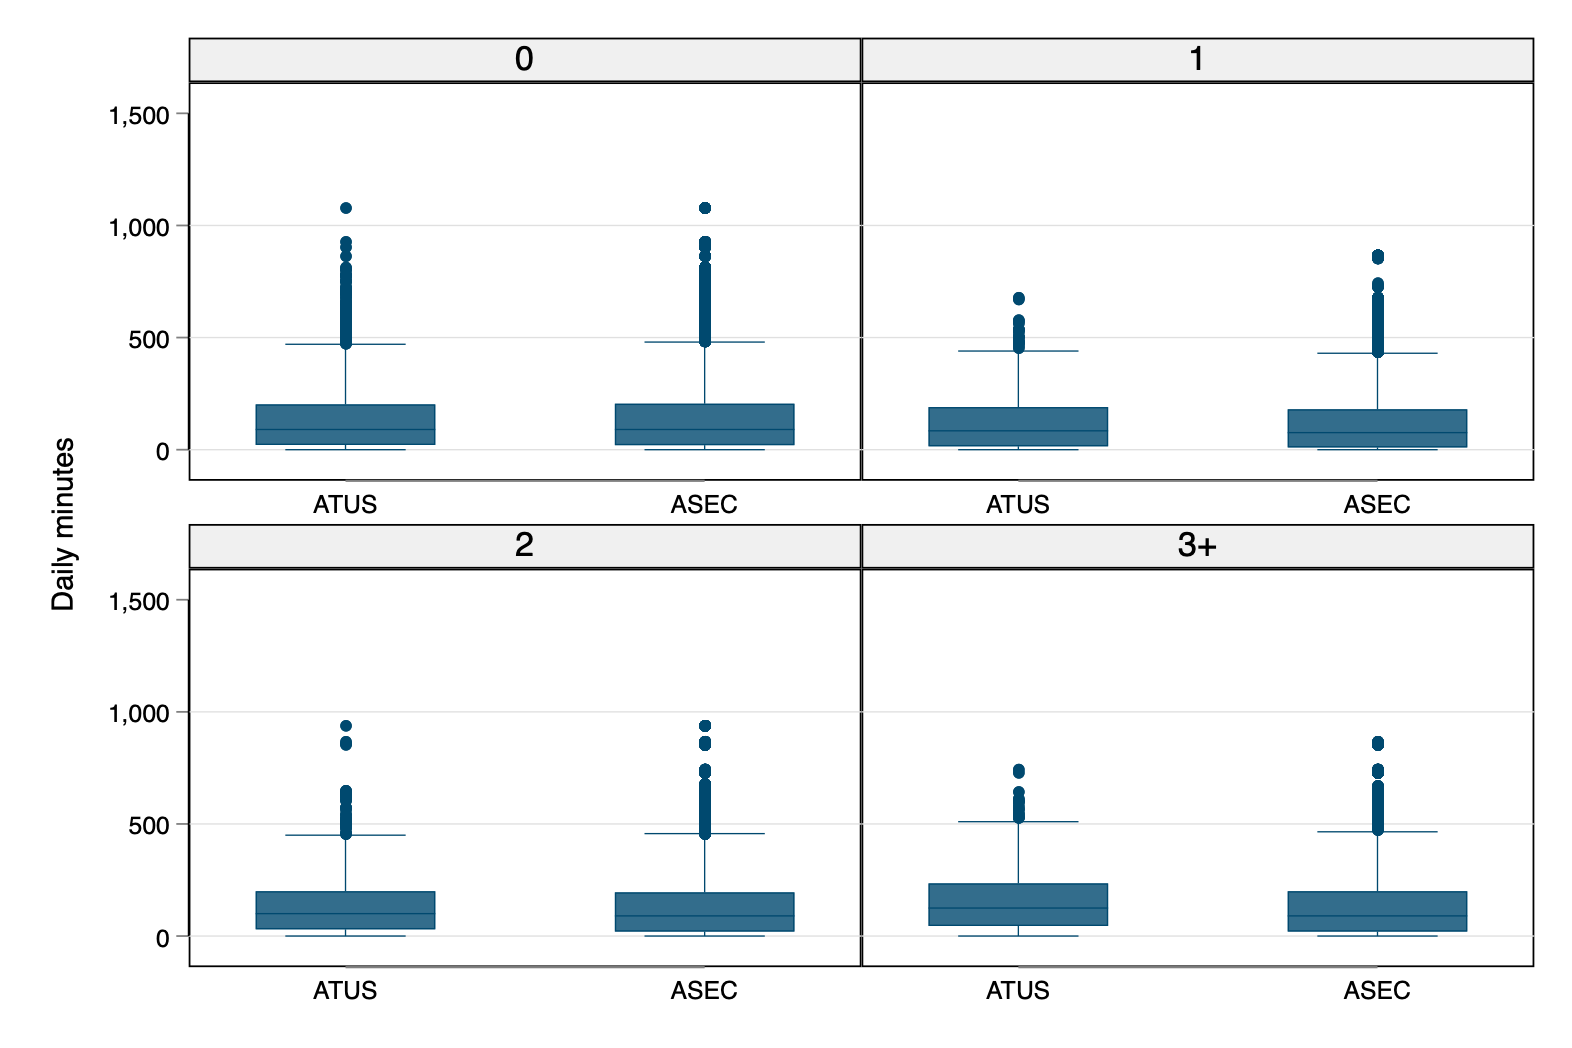
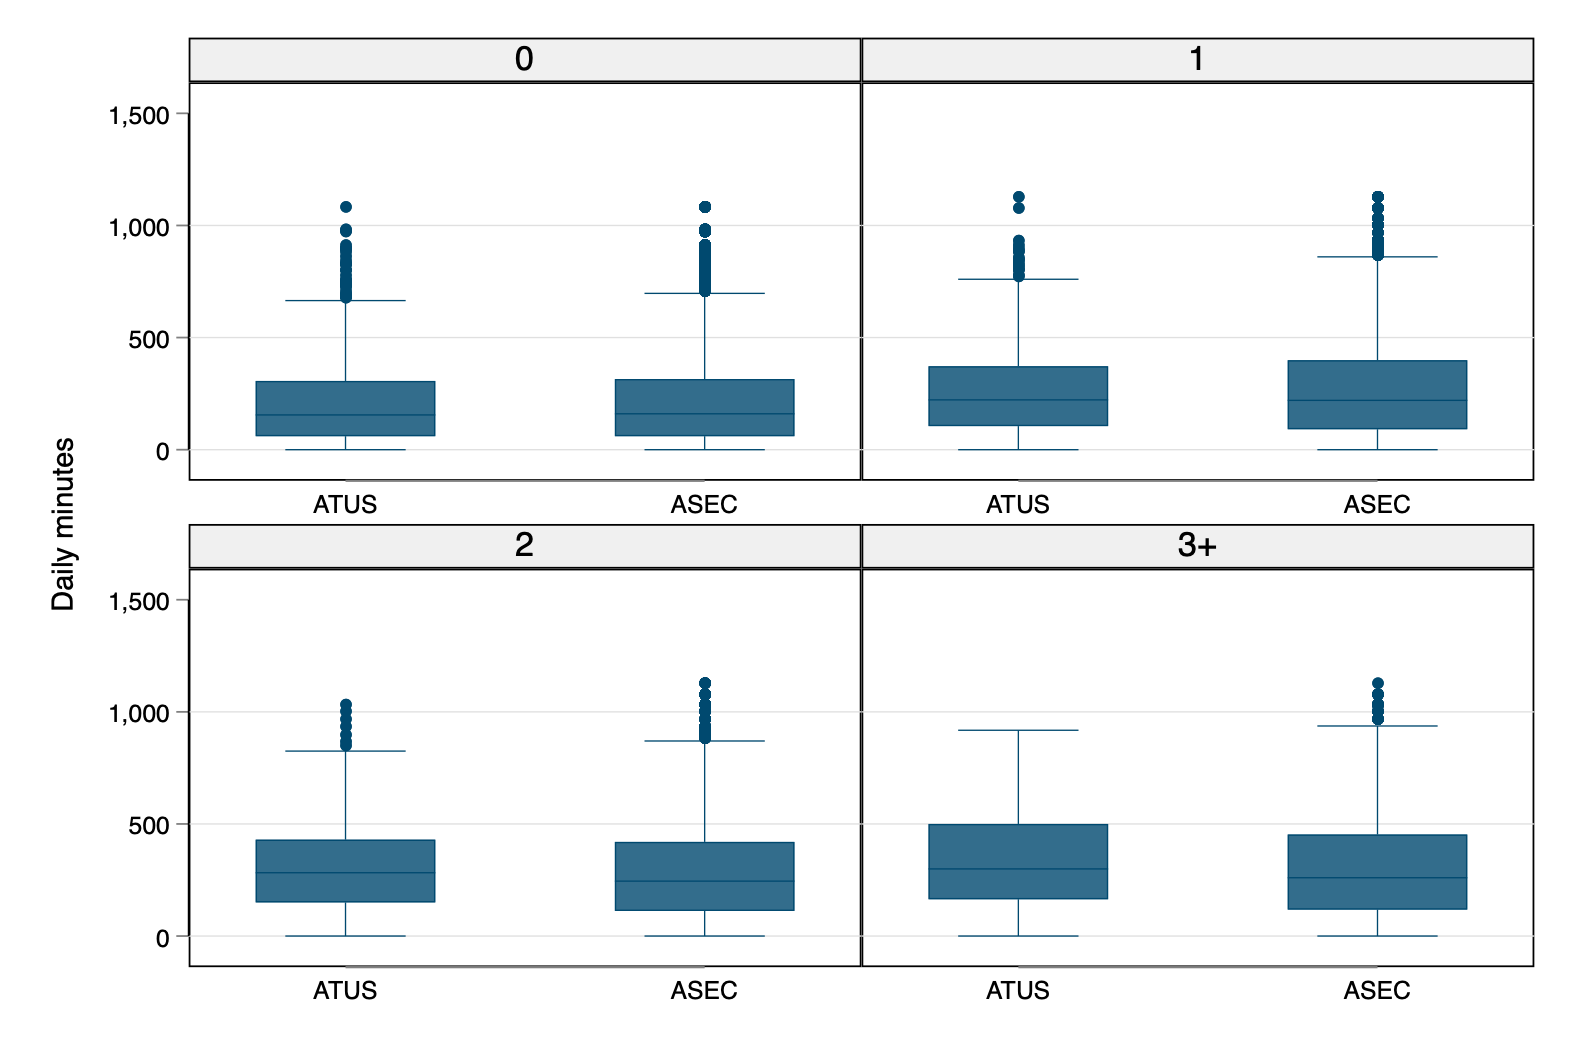
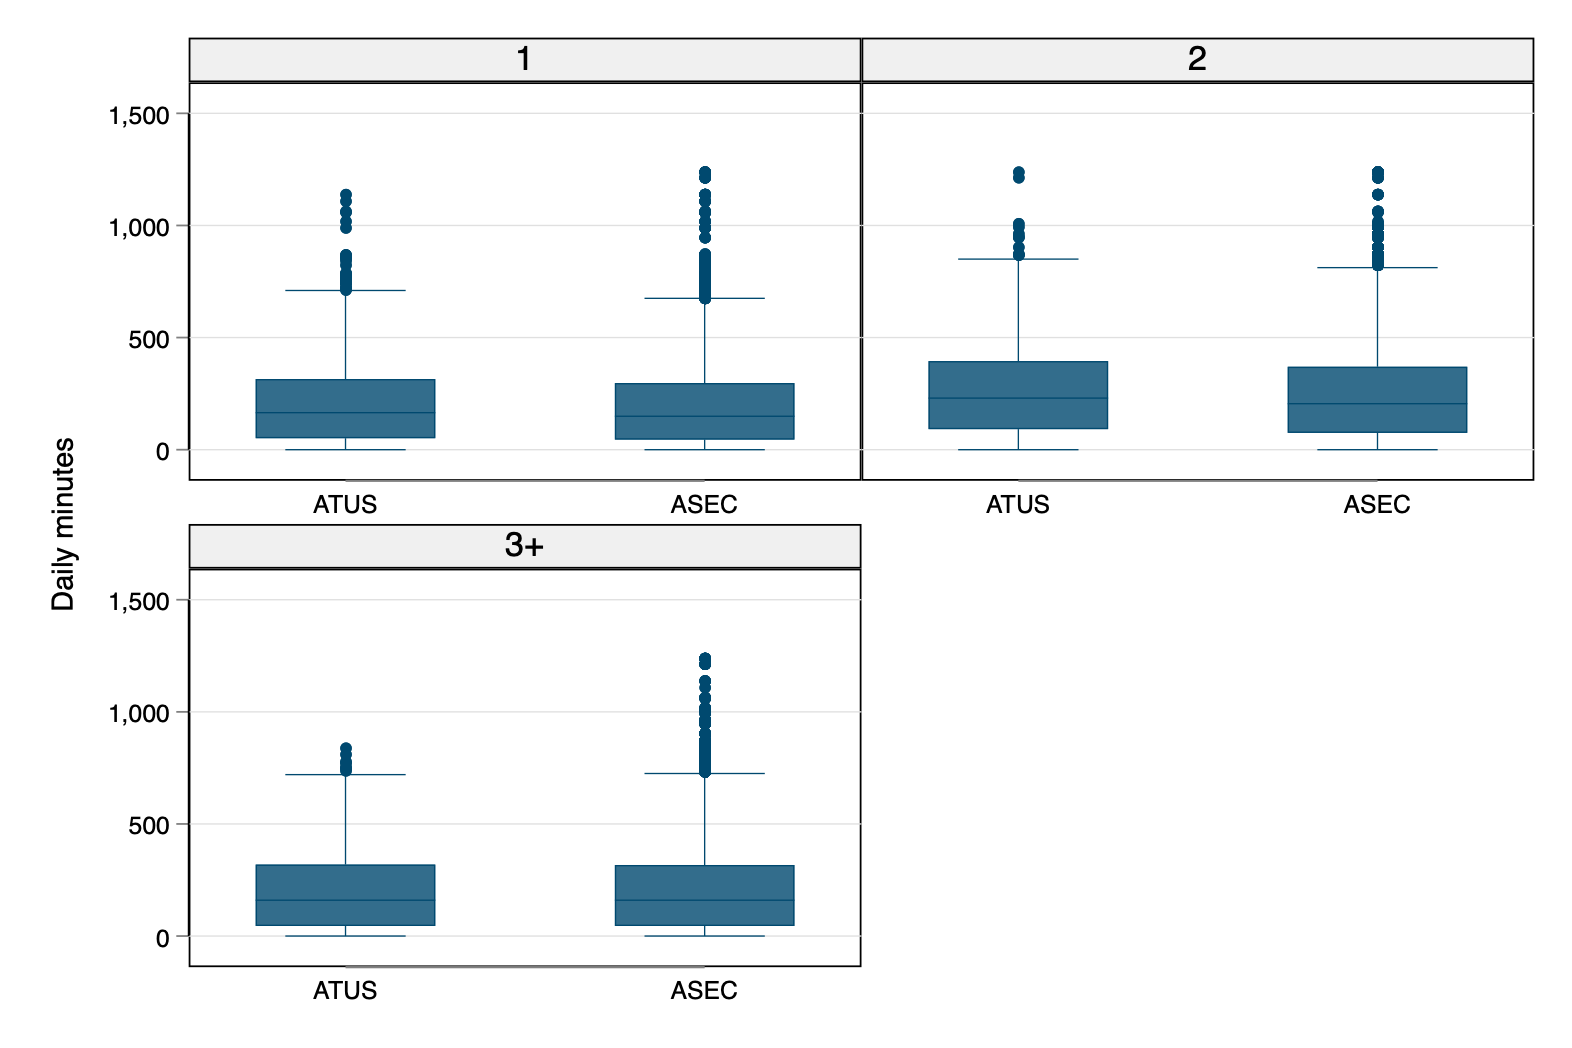
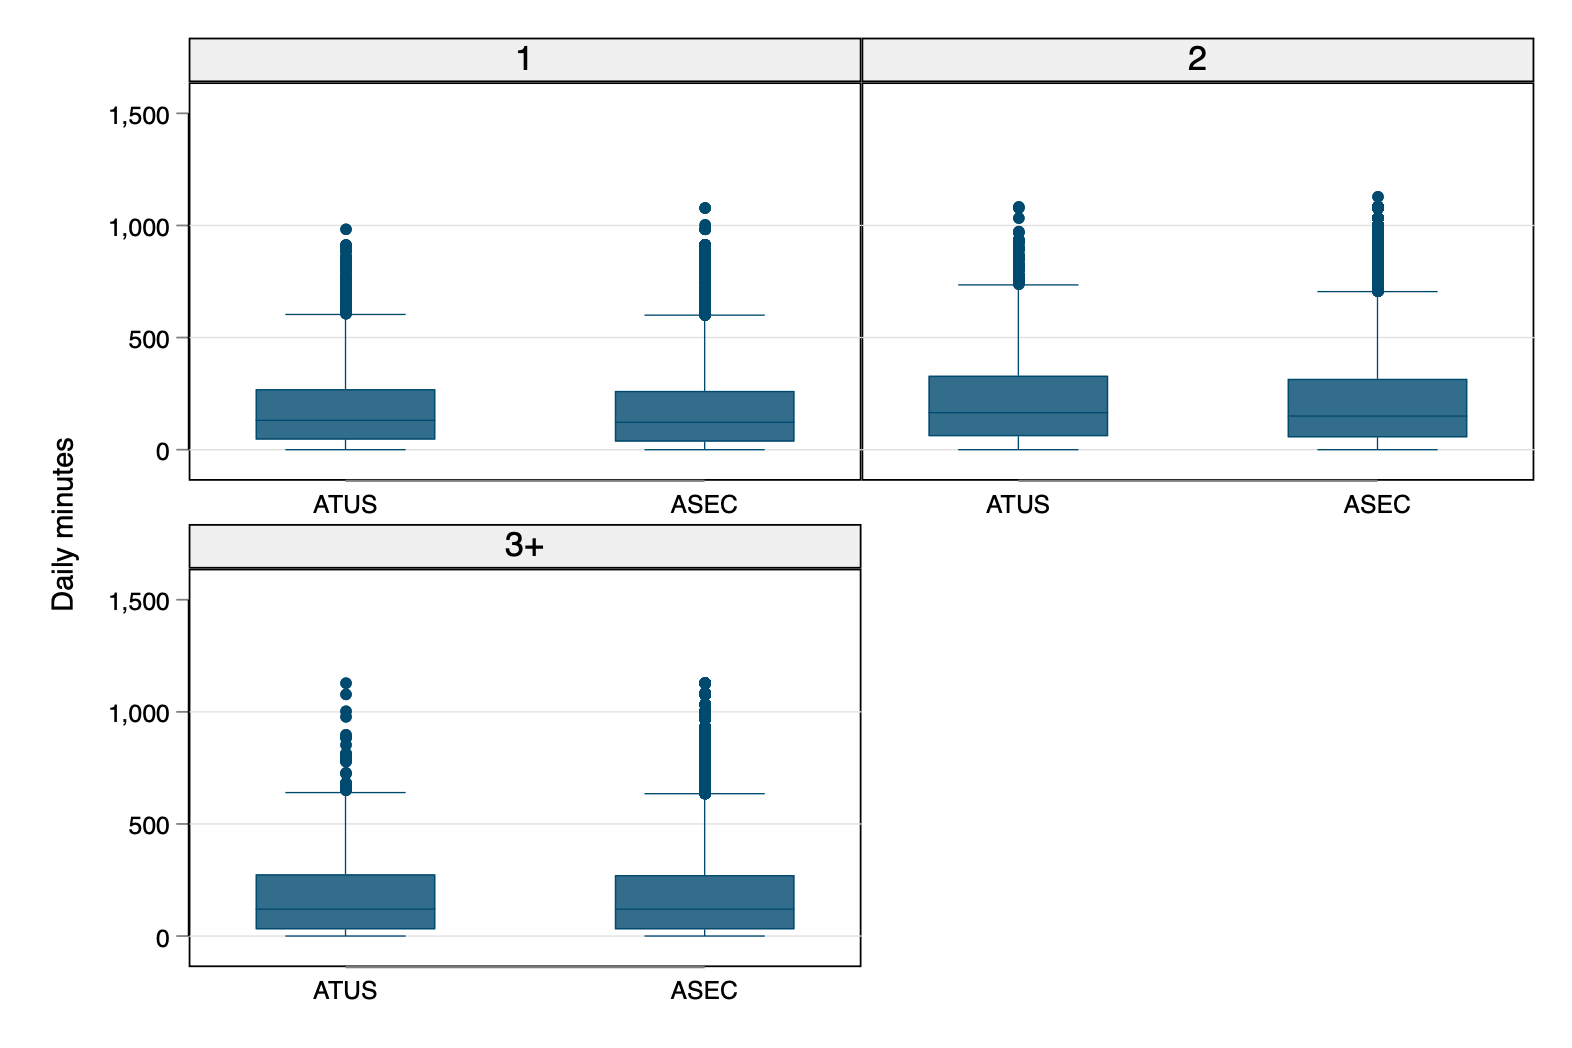
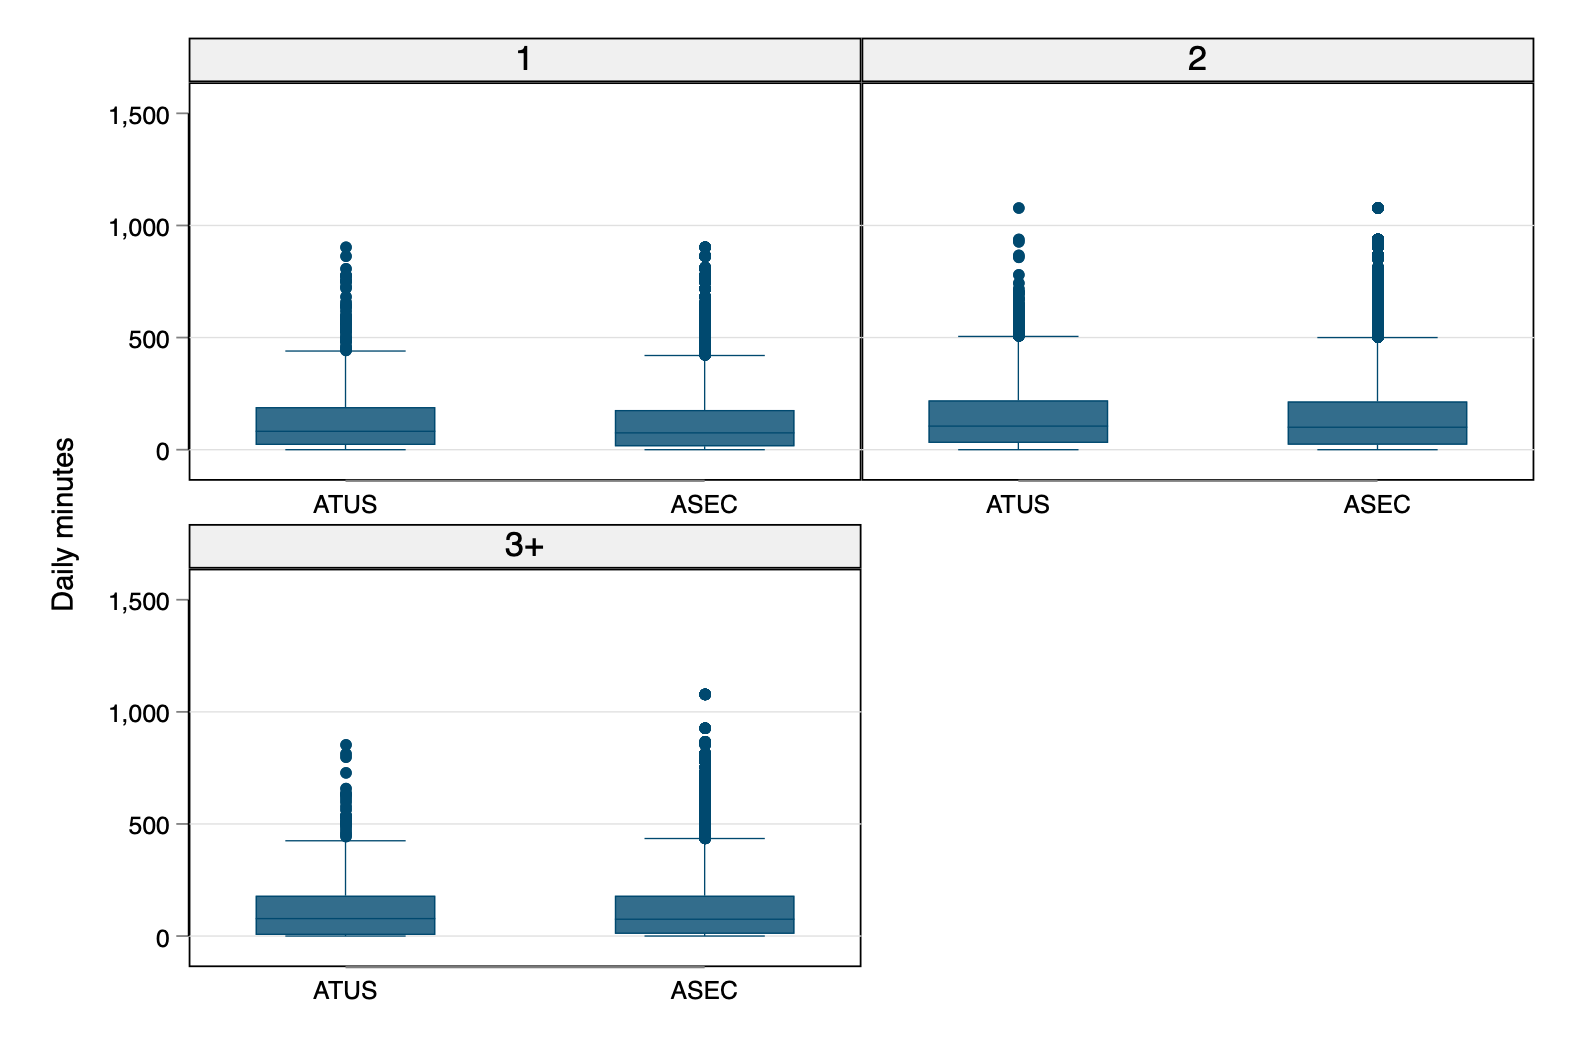
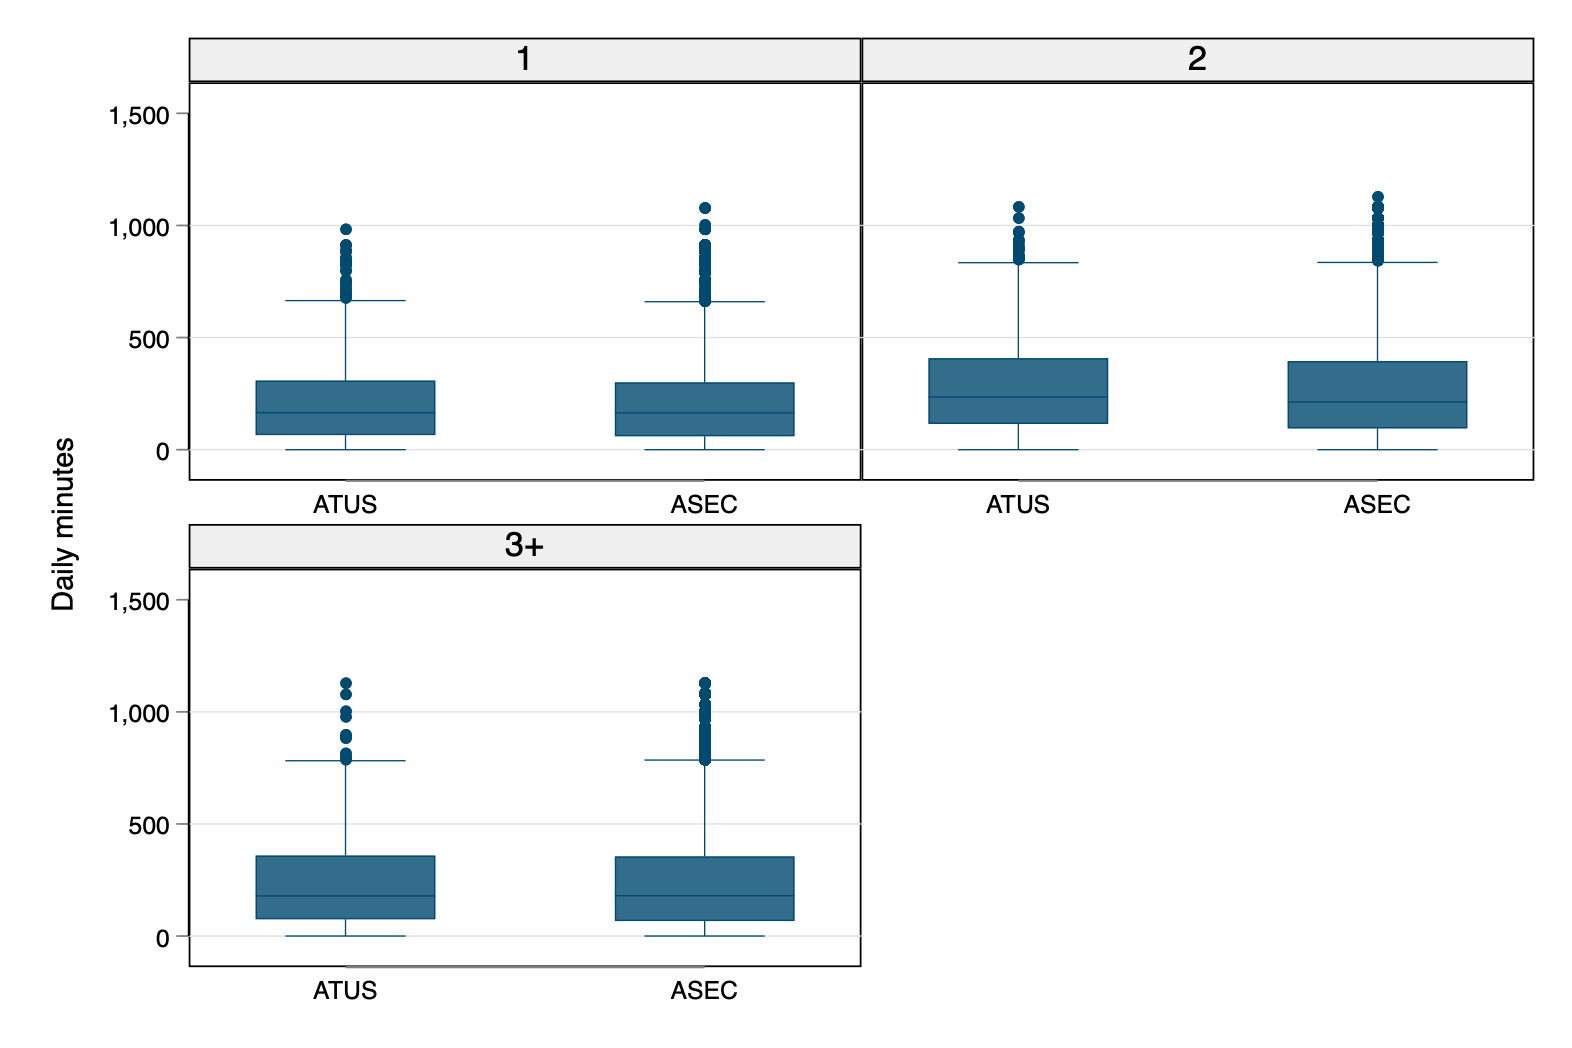
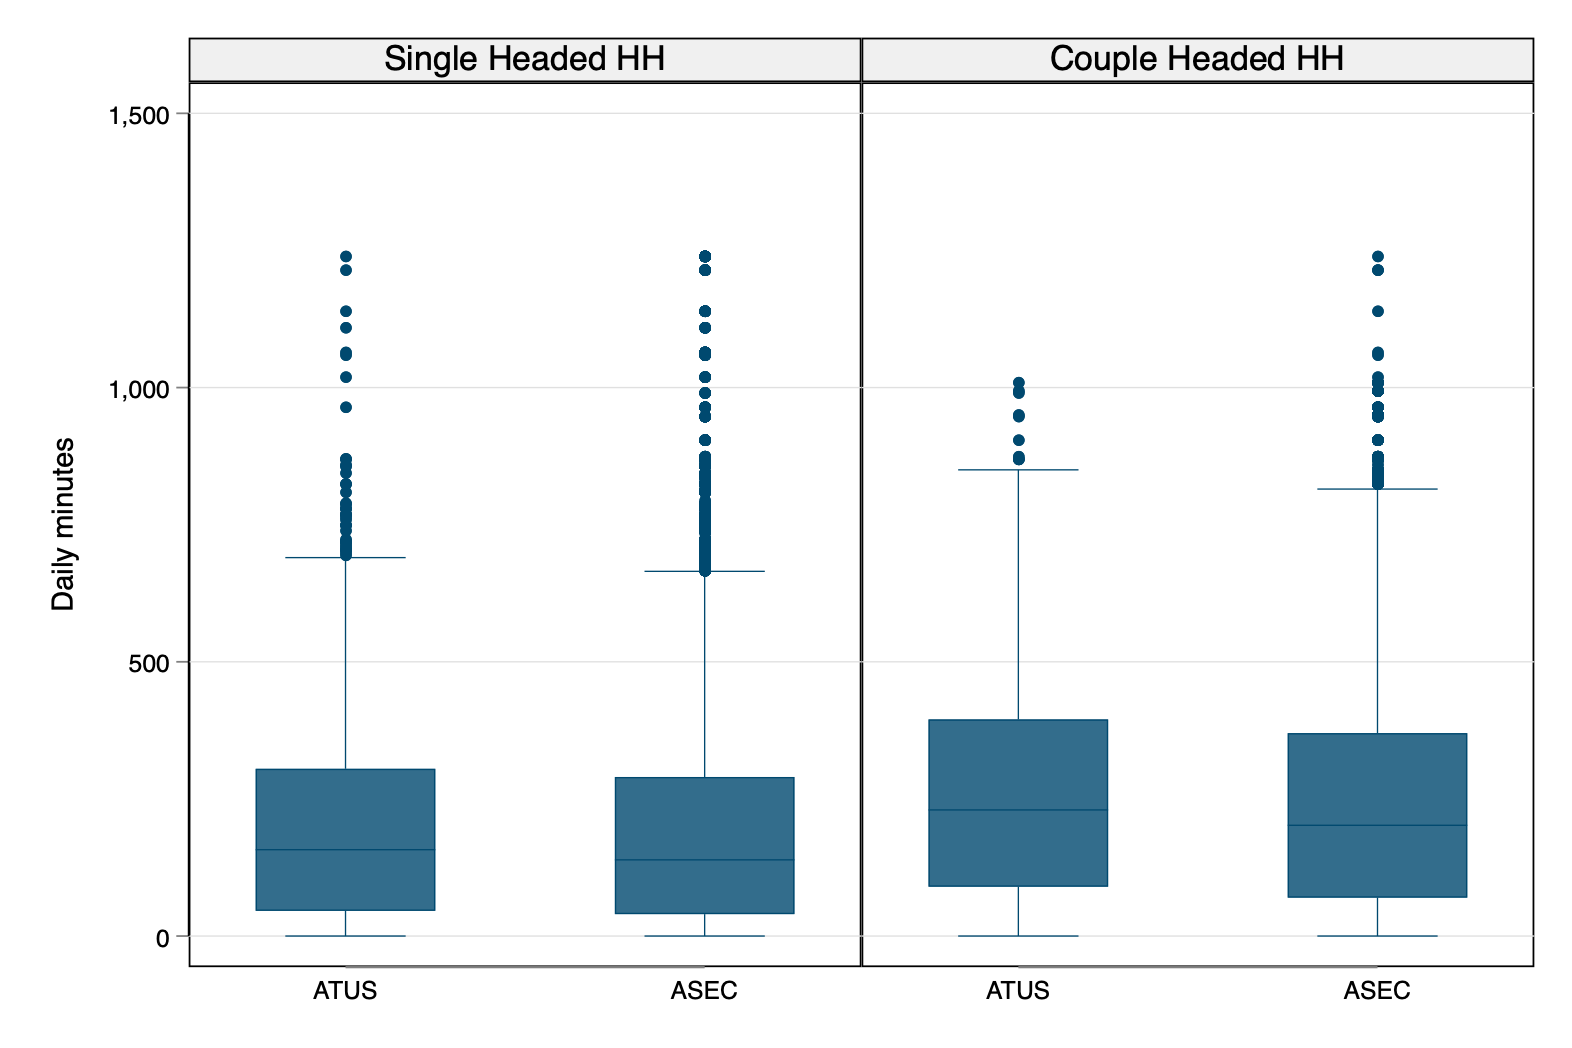
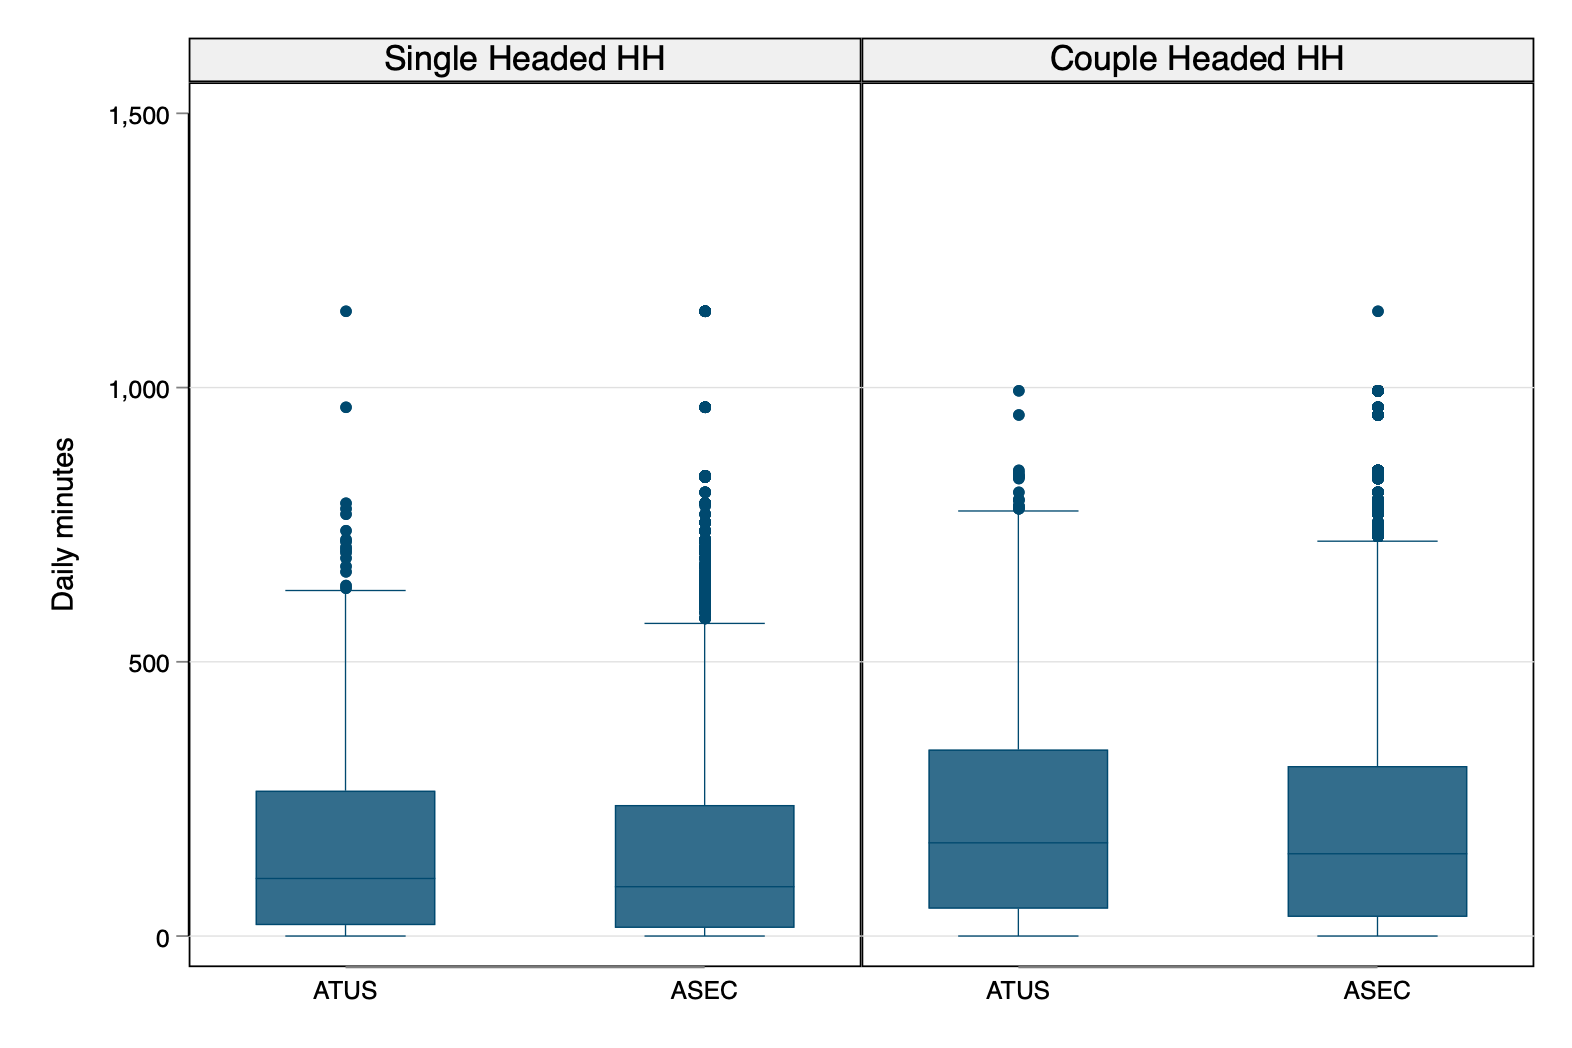
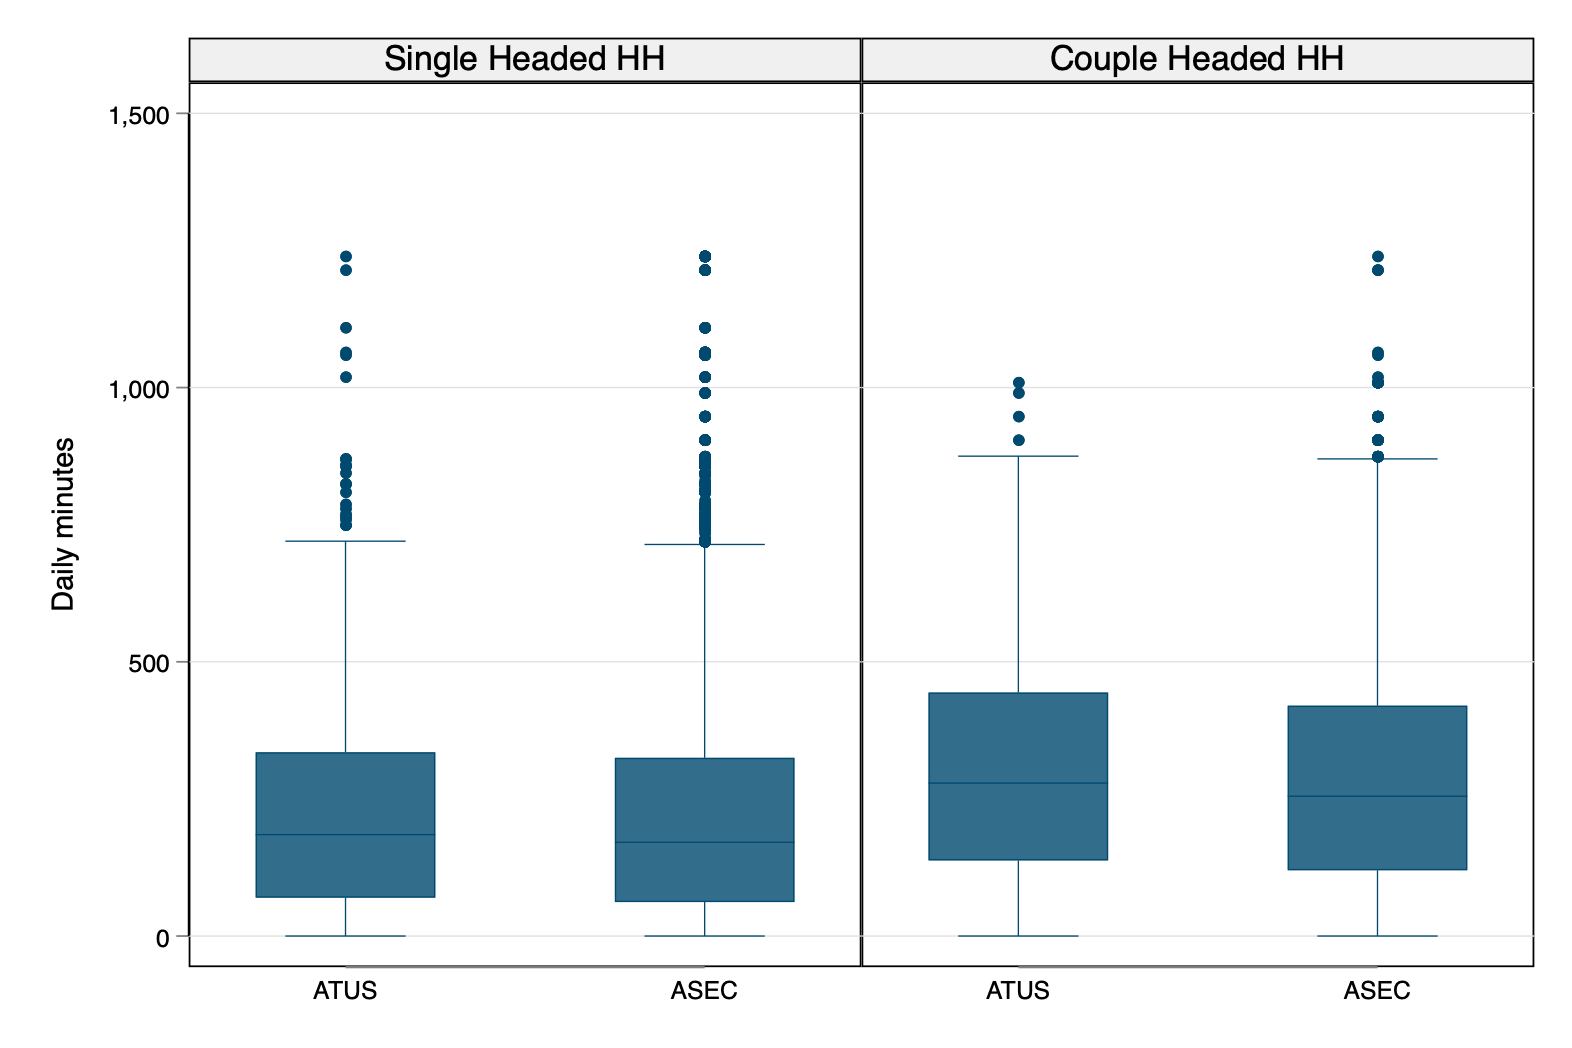
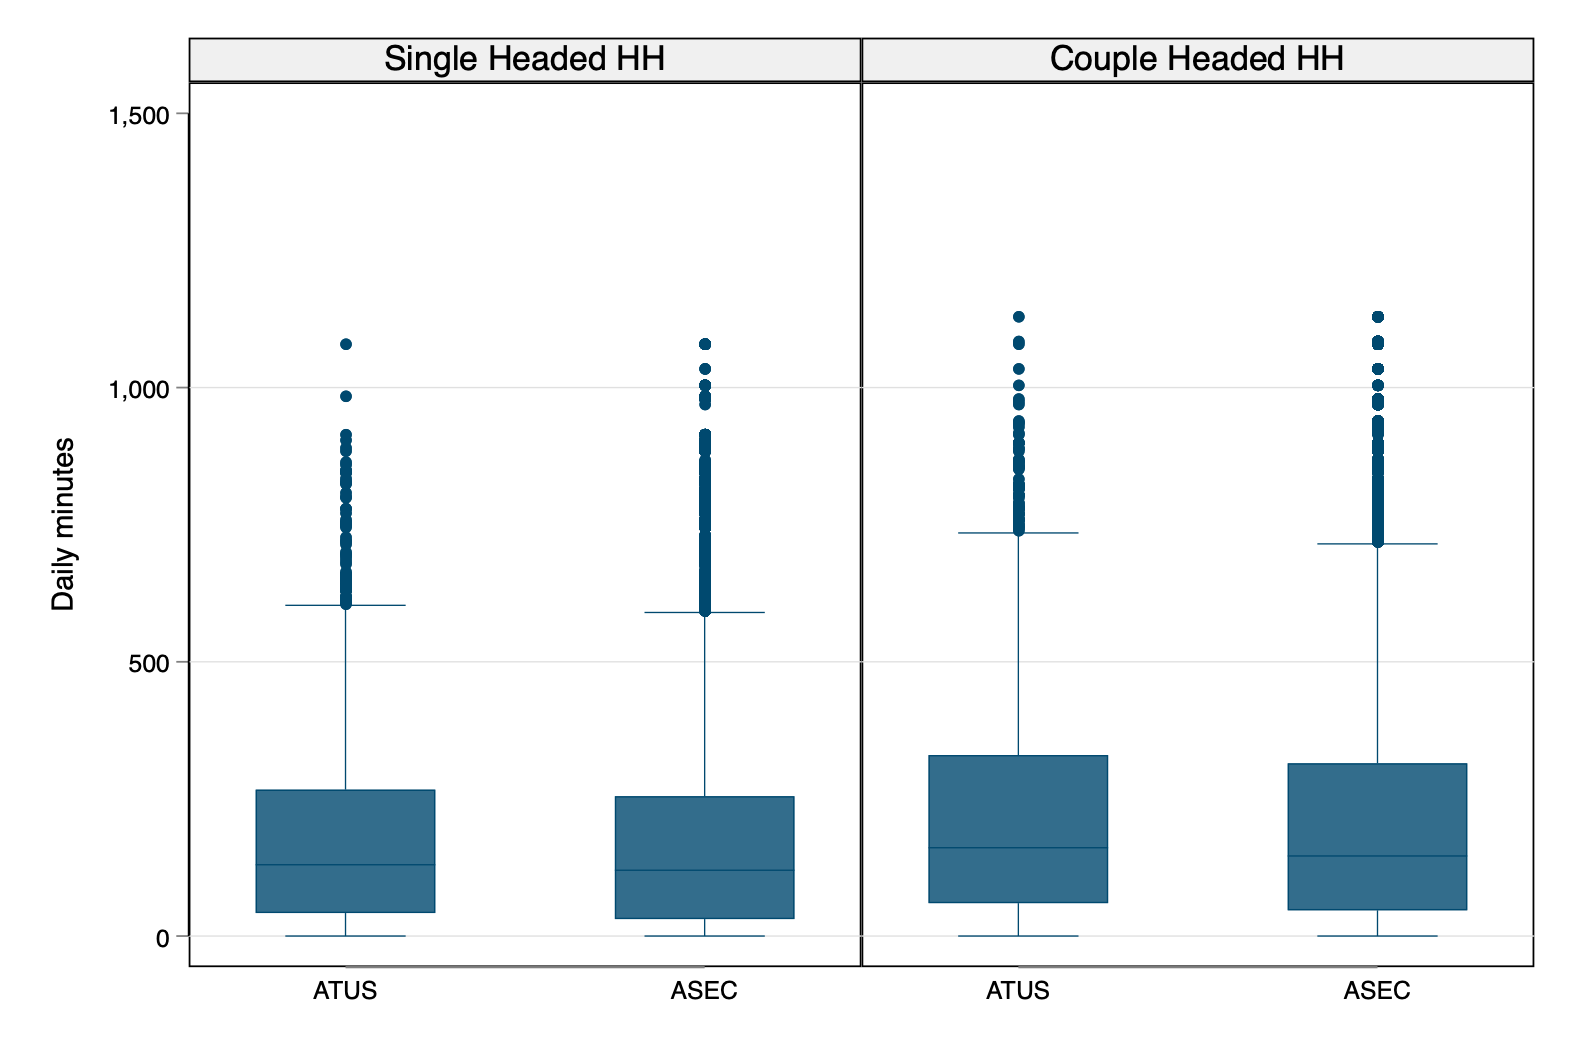
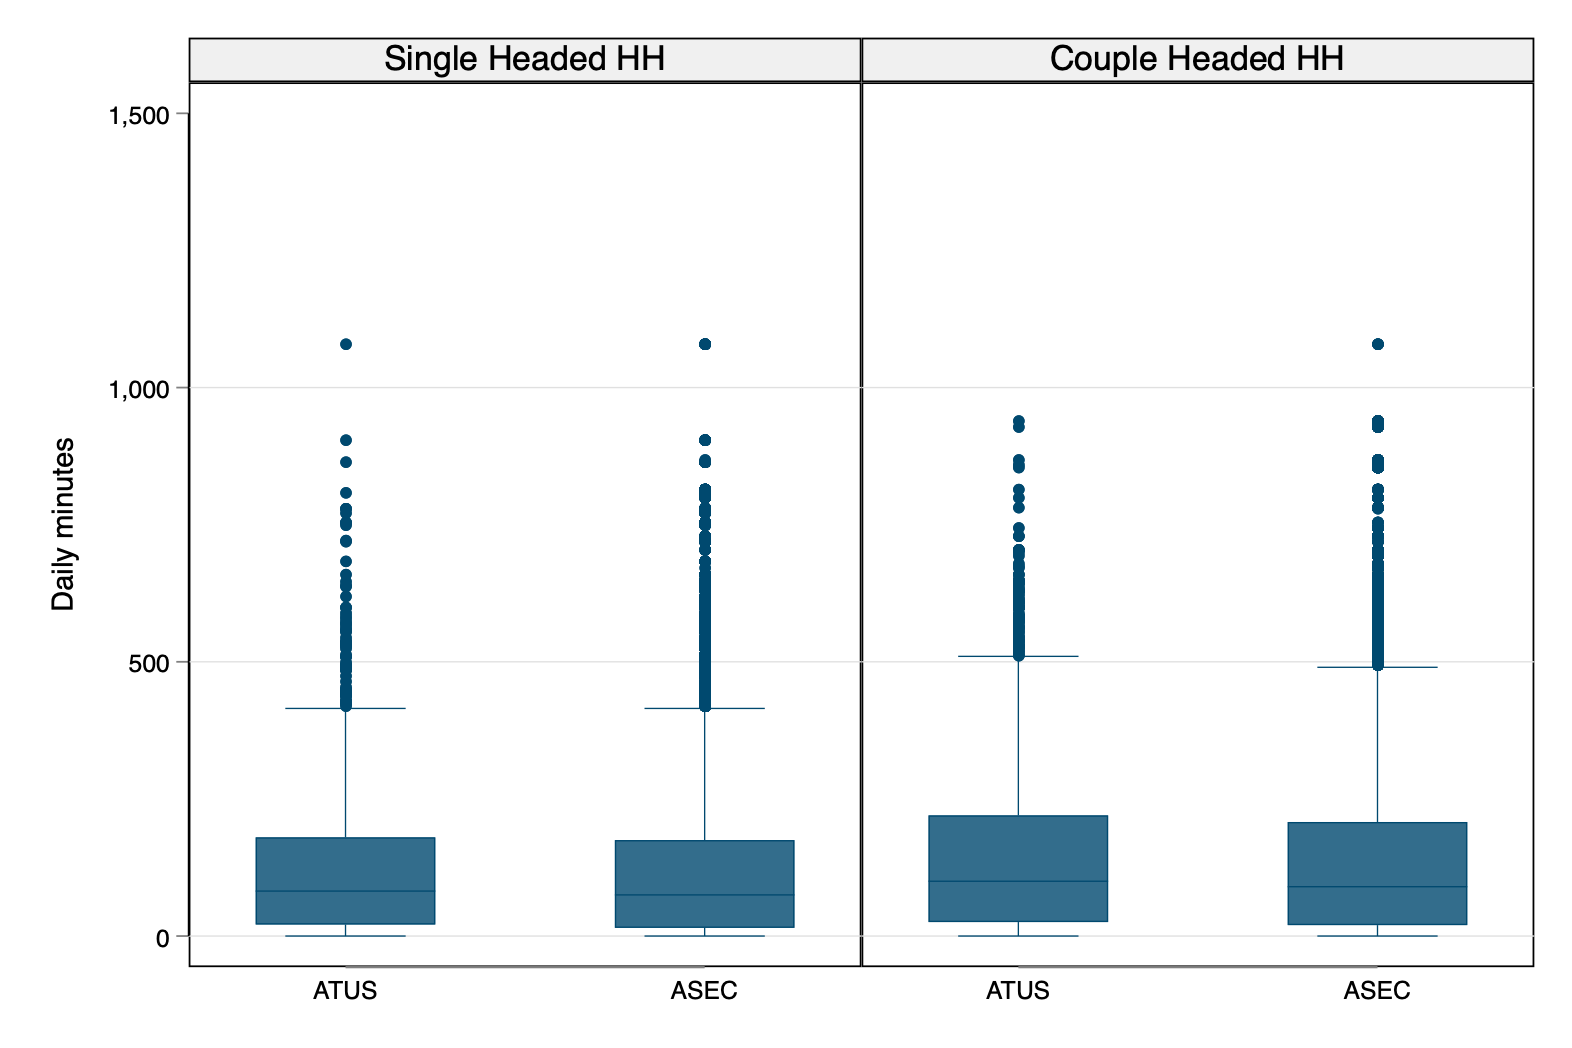
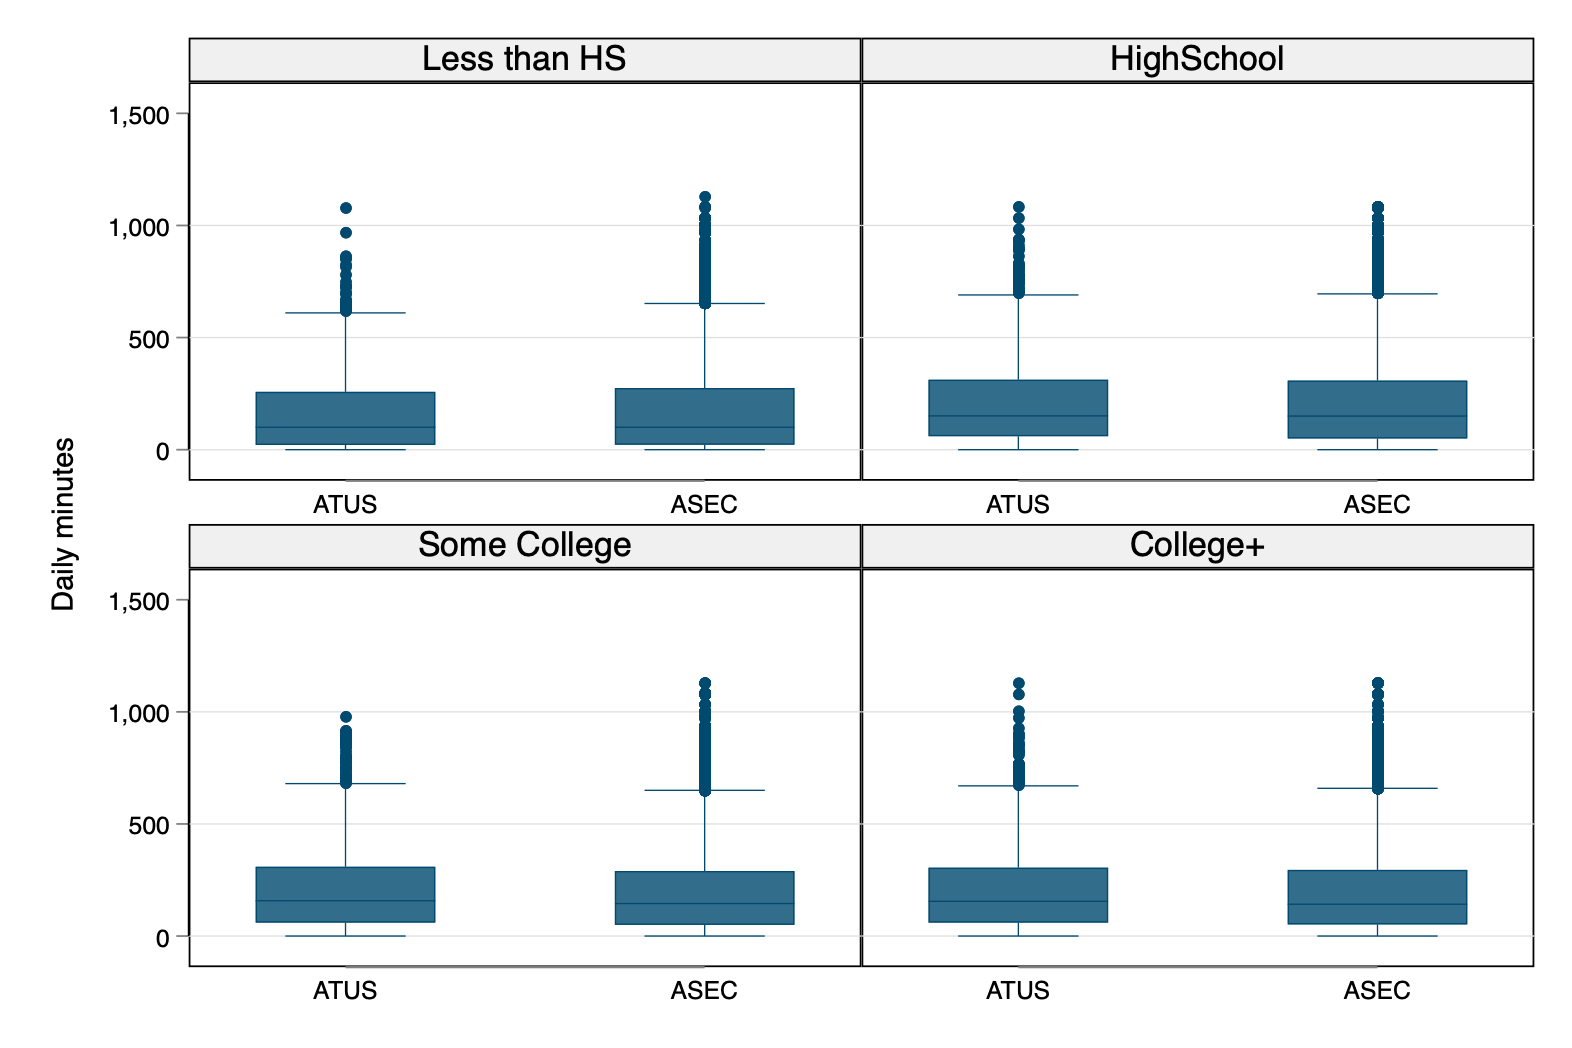
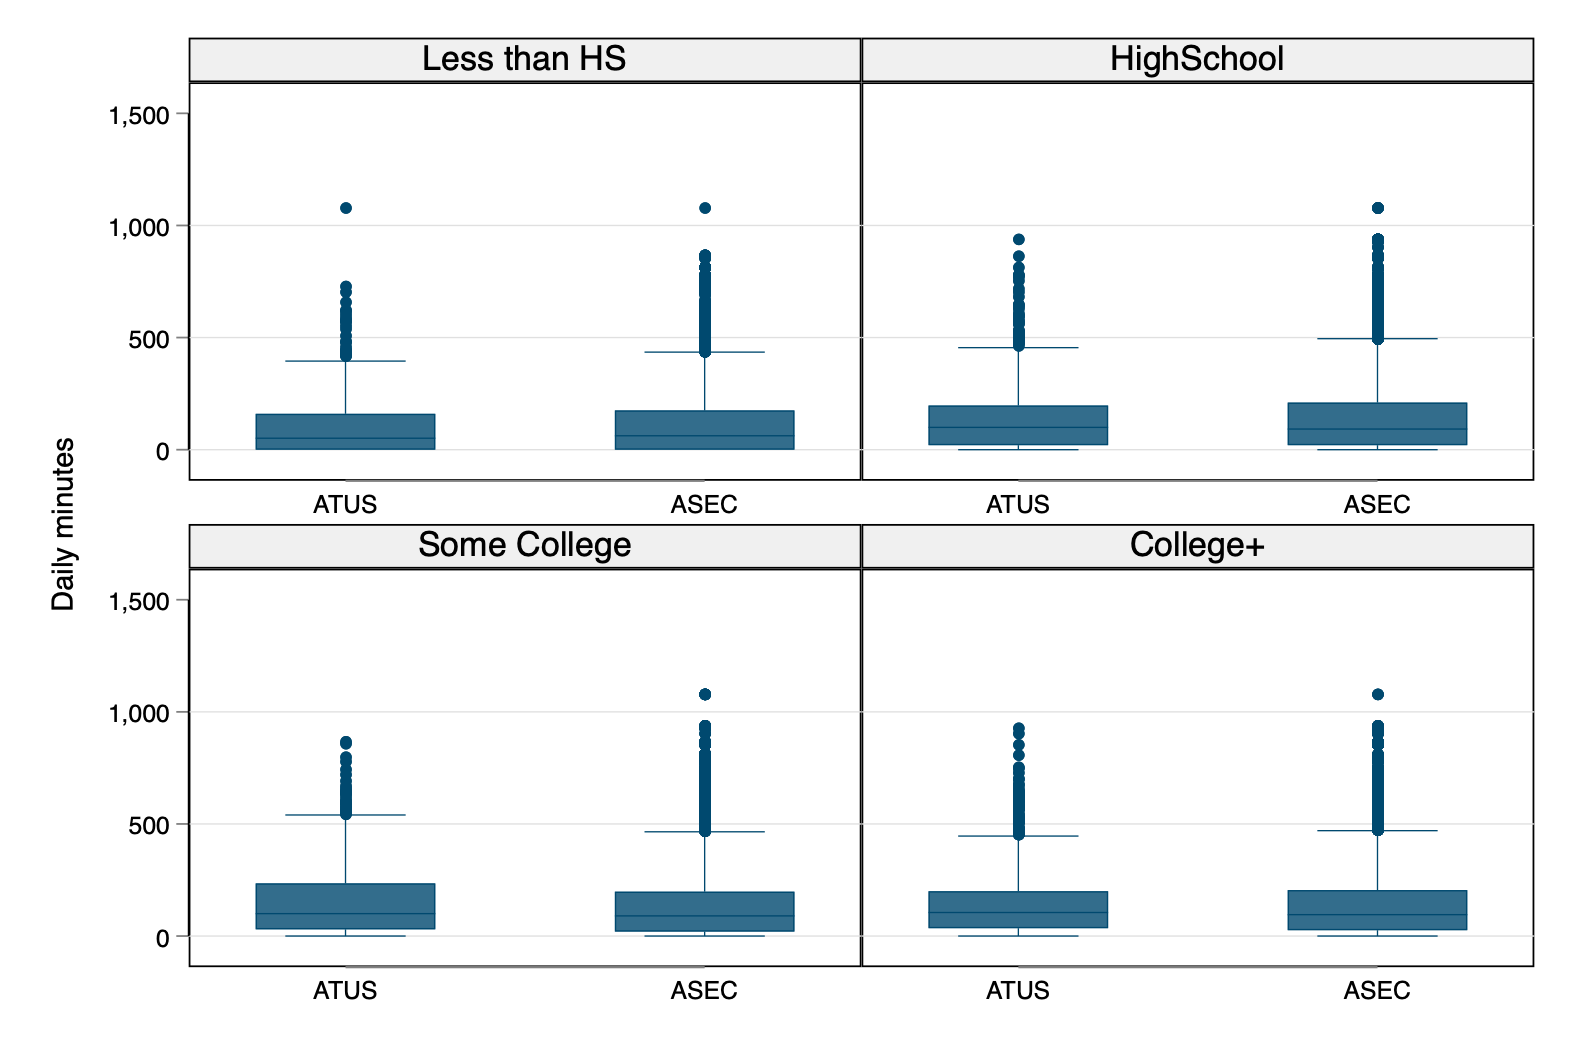
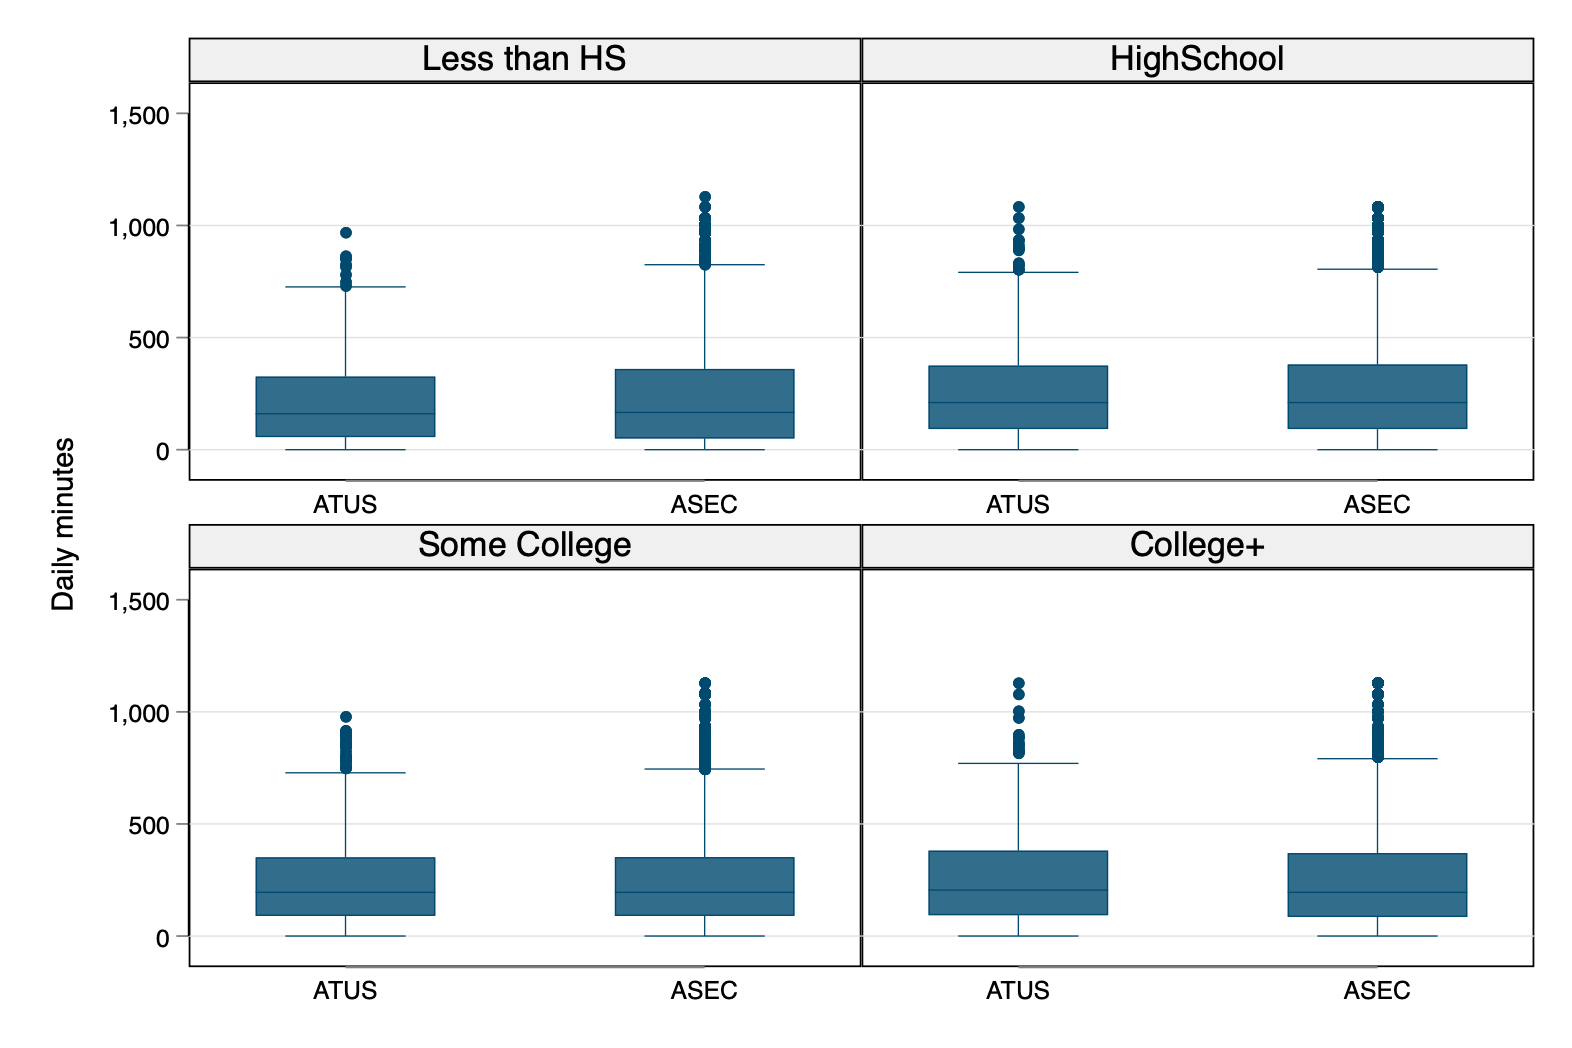
This page contains Box plots evaluating Statistical Match quality between ATUS (weekday and weekend) and ASEC data.
This is done by comparing the distribution of total daily time spent on household production. We present the figures for the main strata group (sex has children and employment status) and for various selected variables.
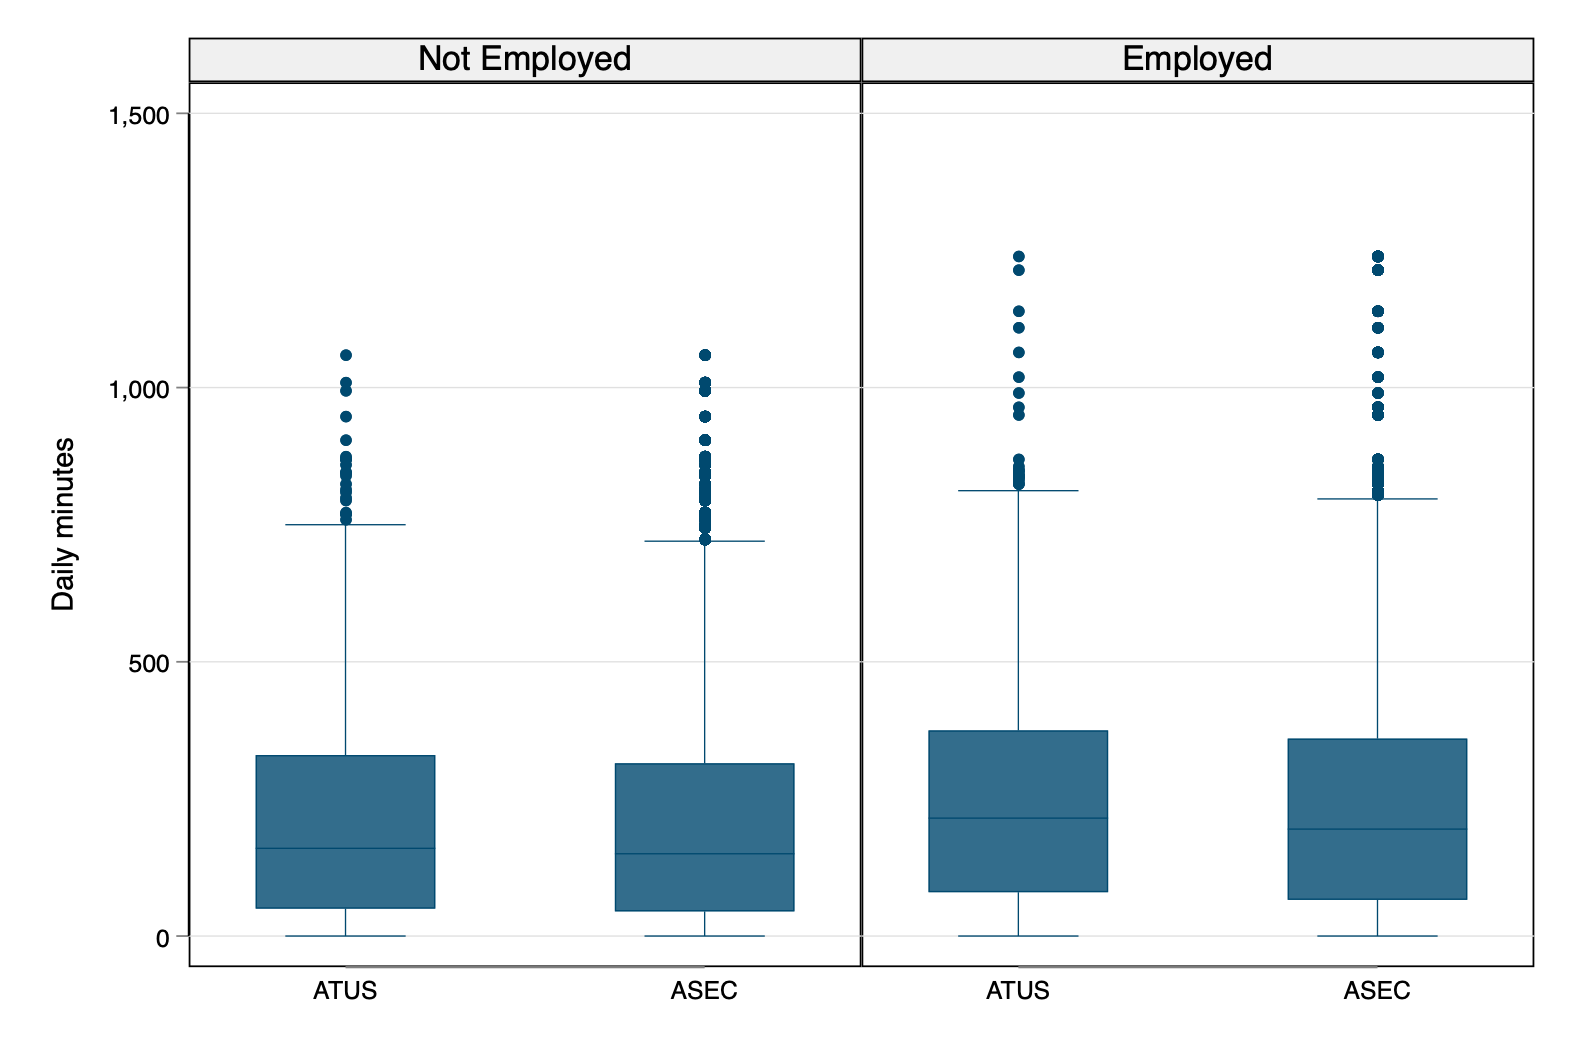
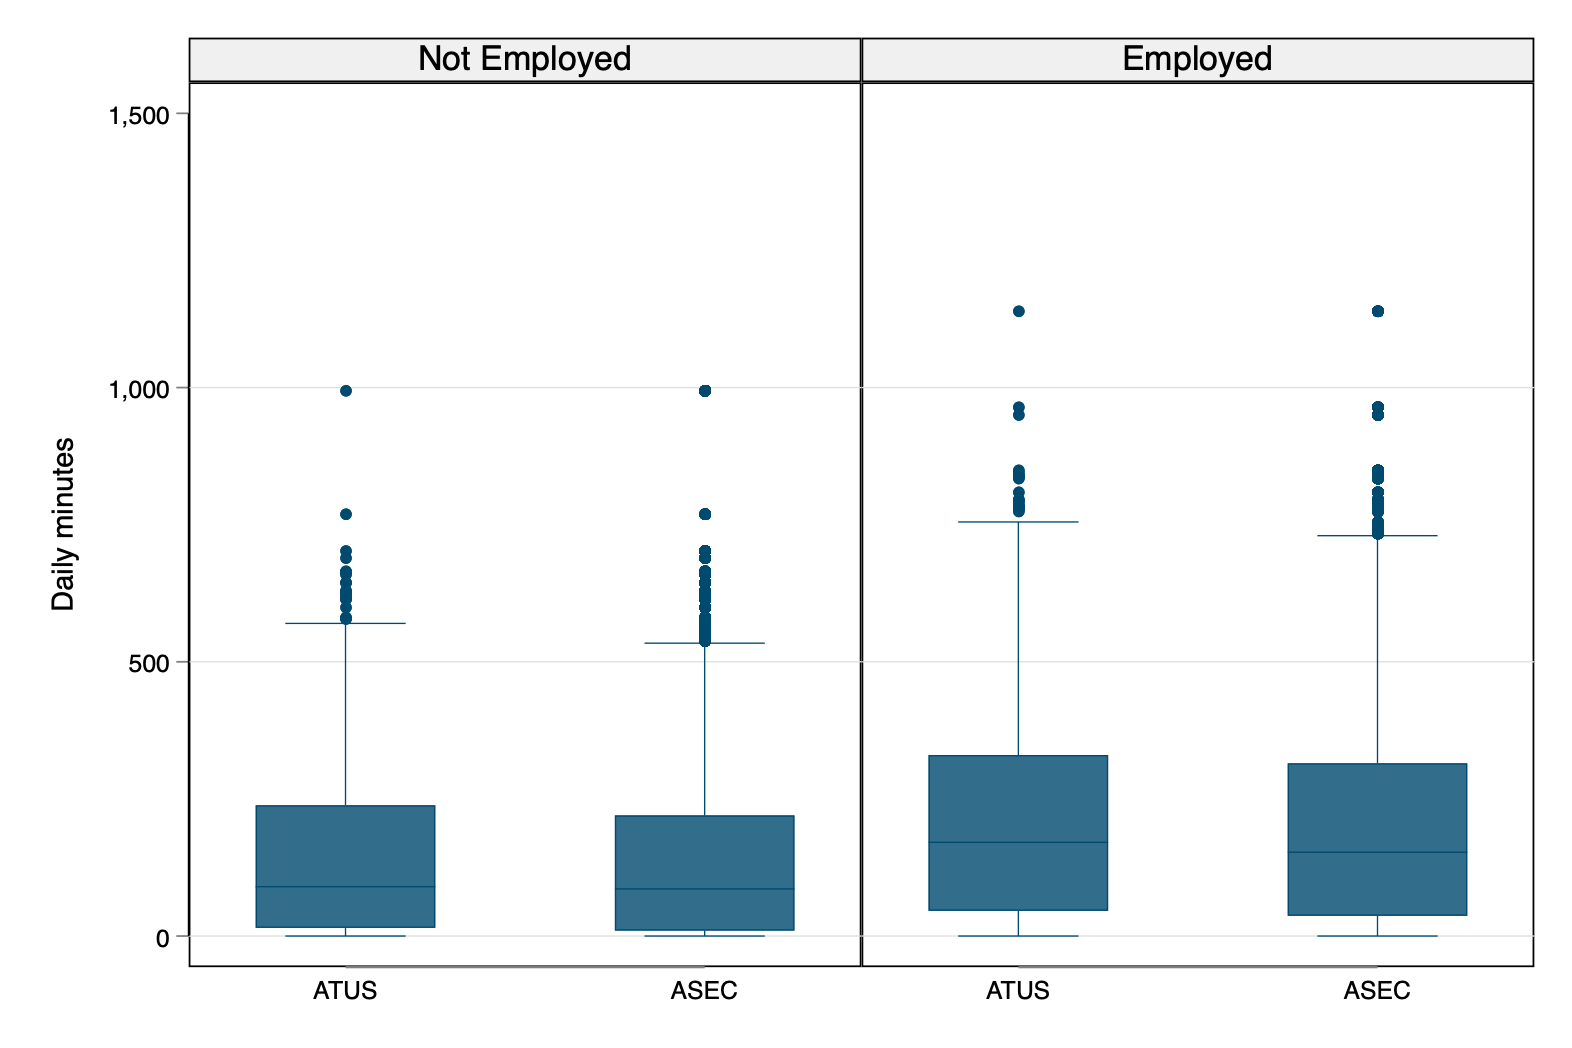
Gender x Child x Employment
Weekend
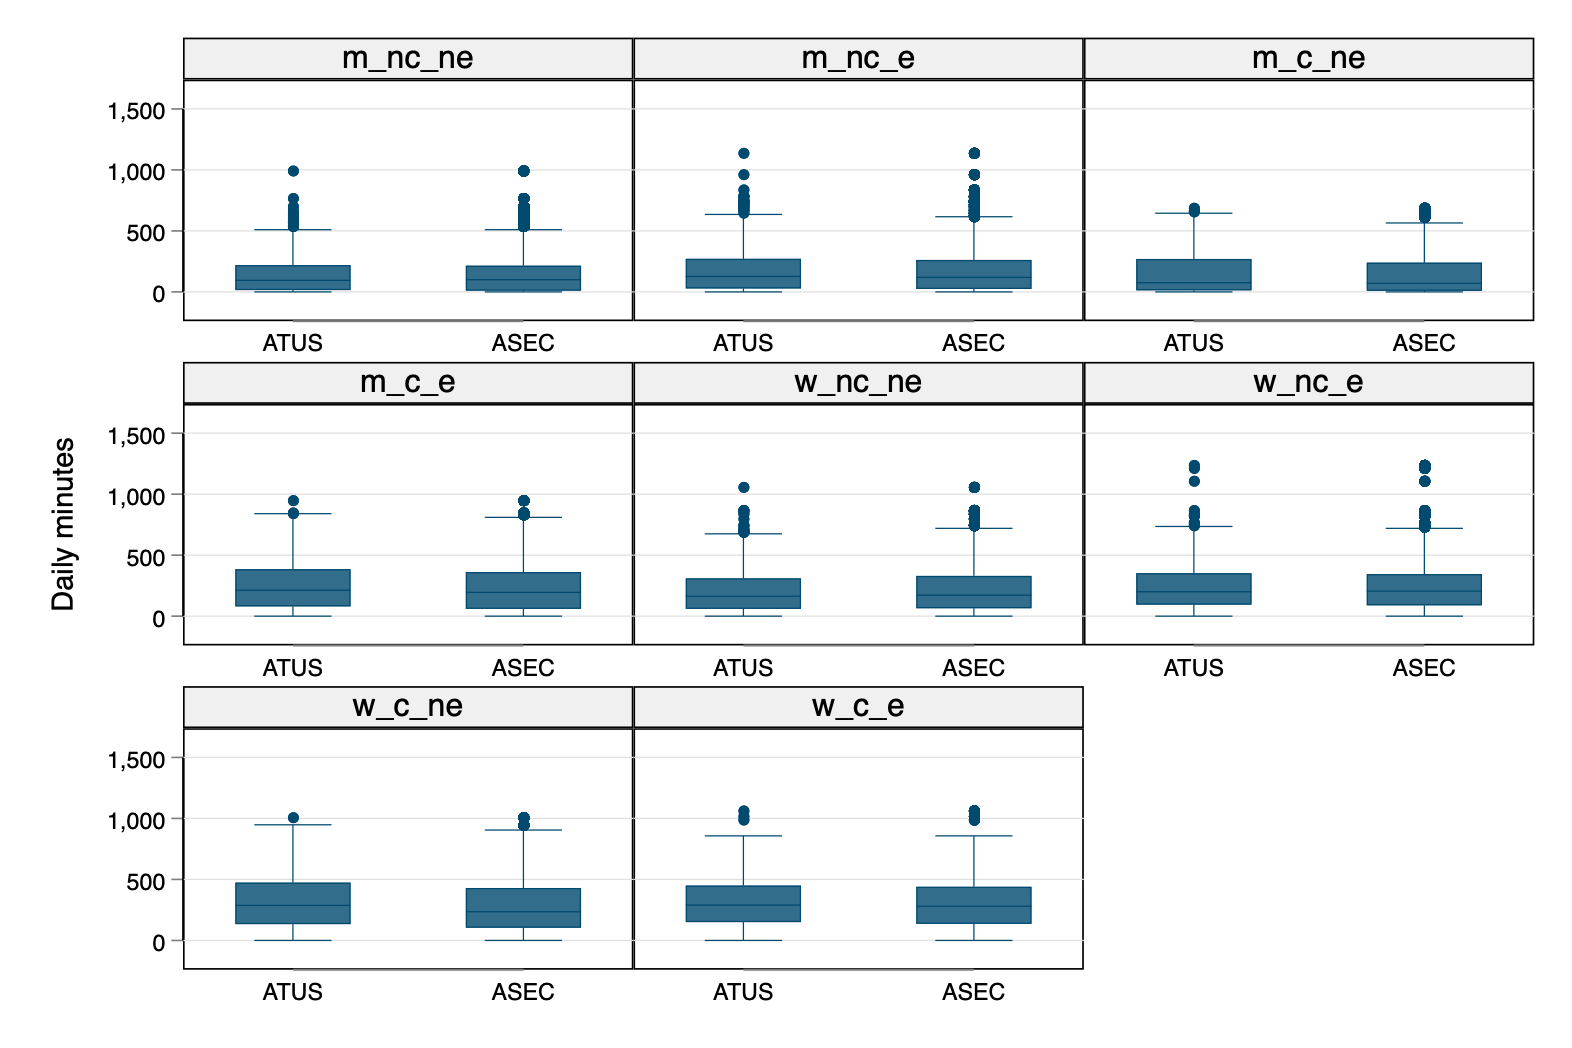
Weekday
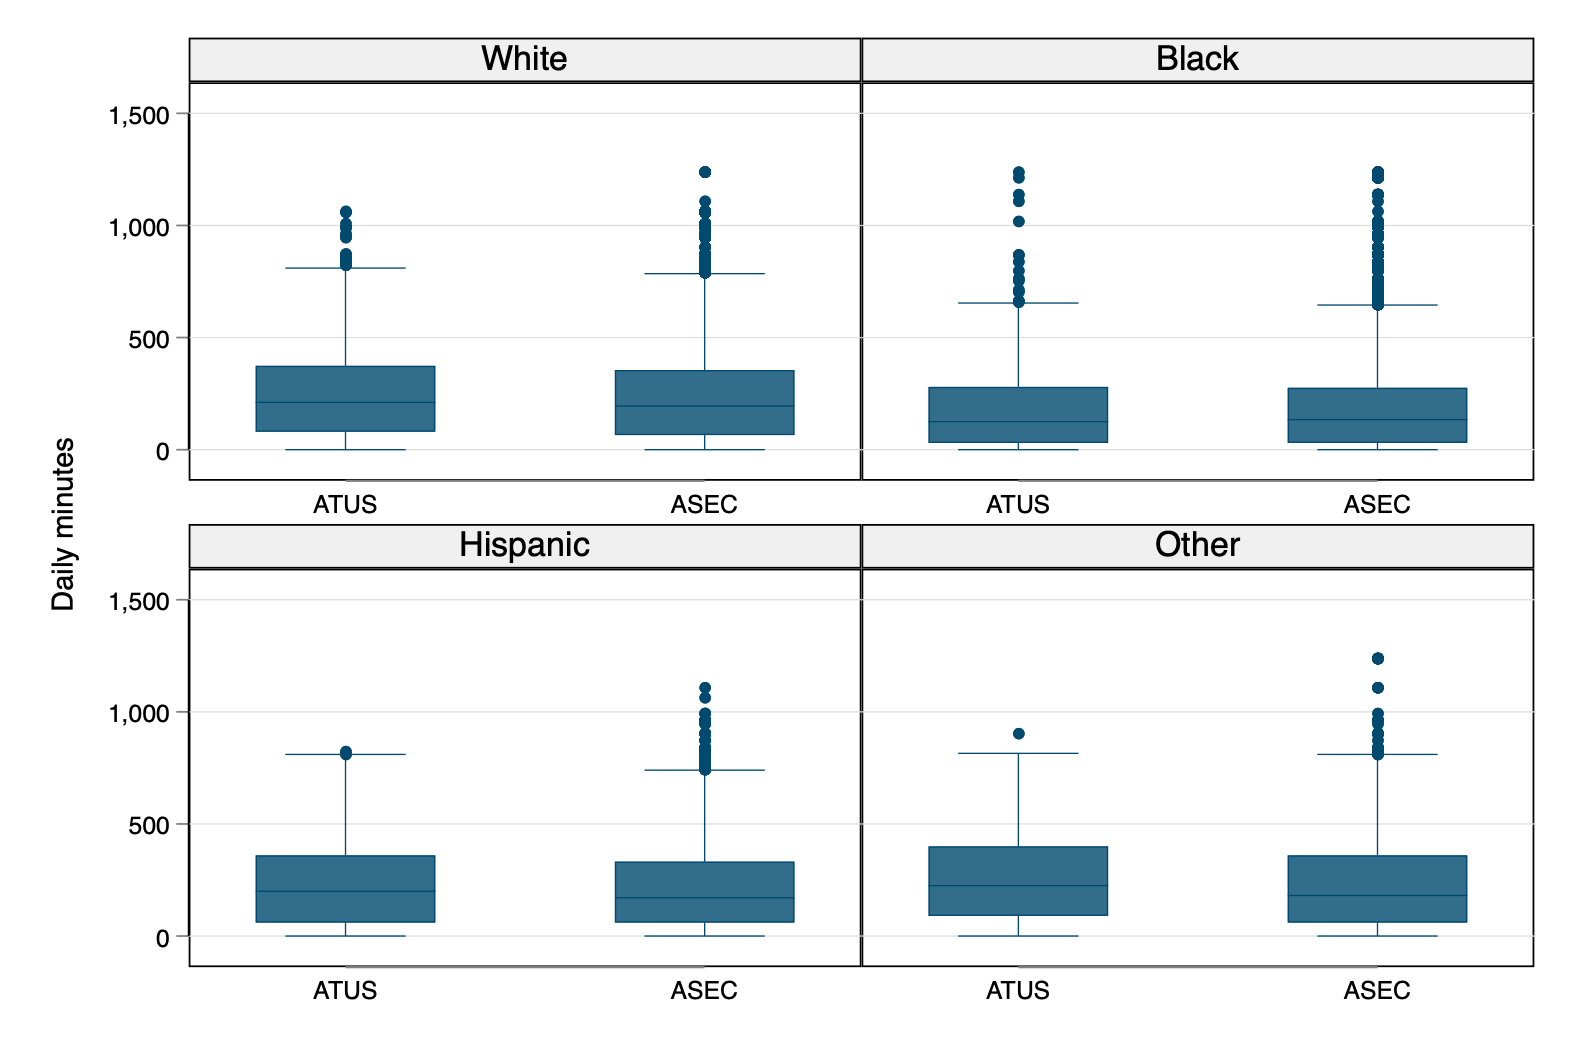
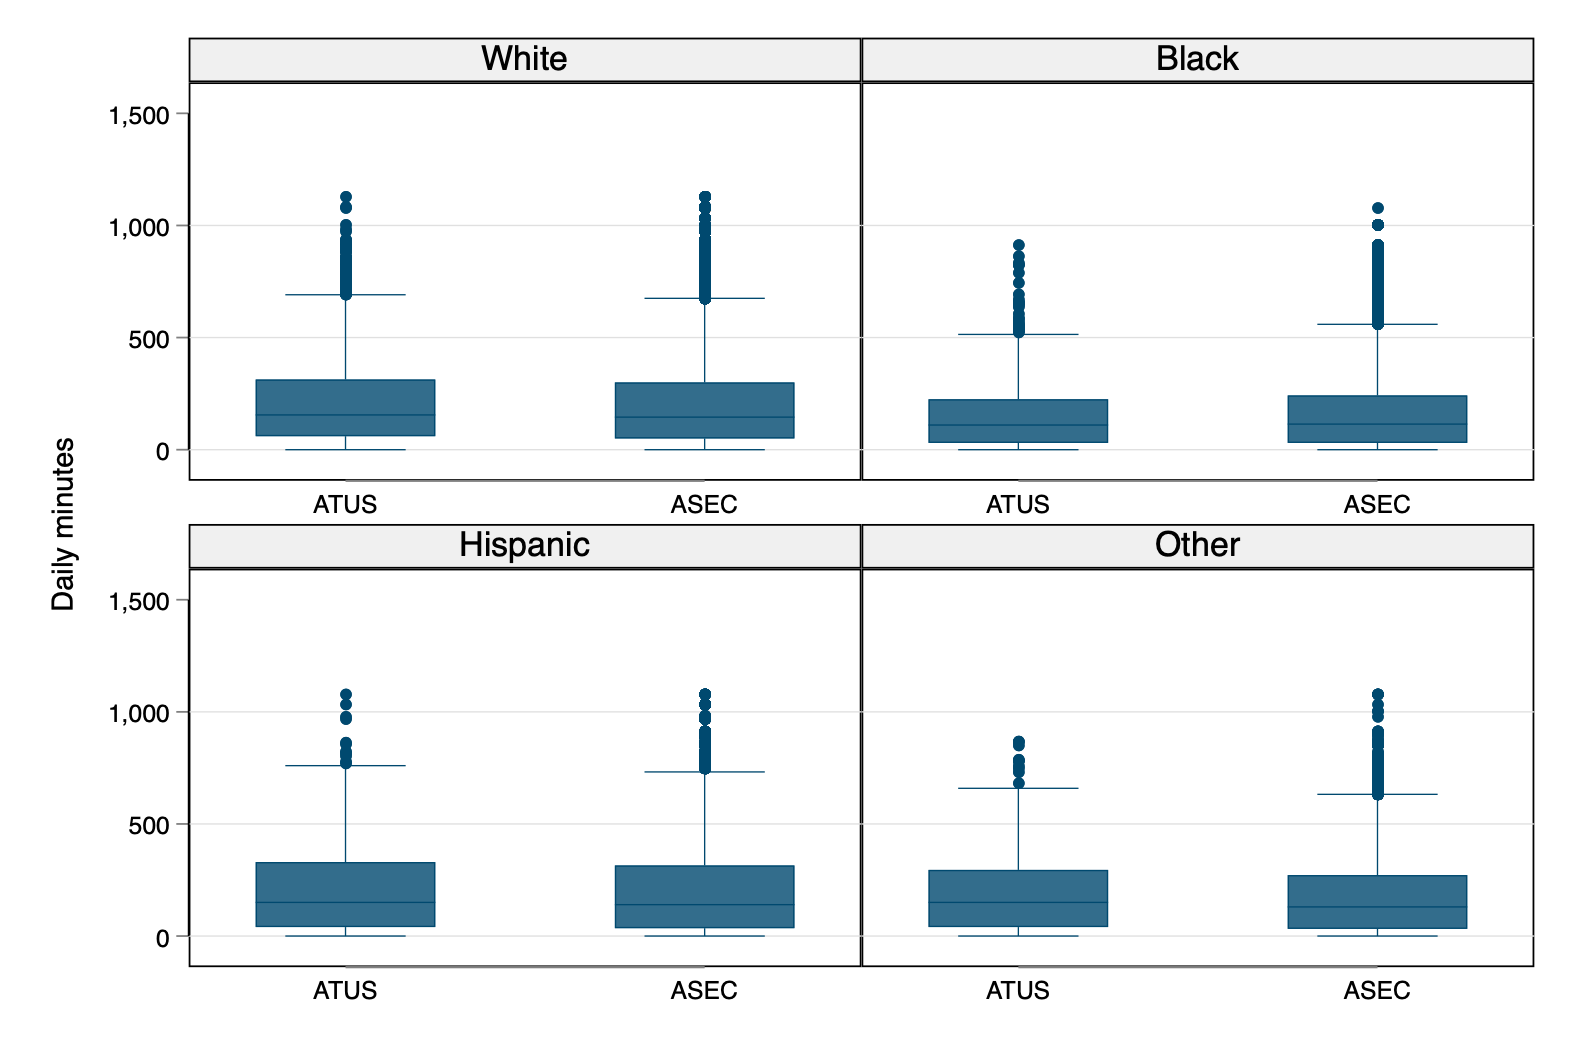
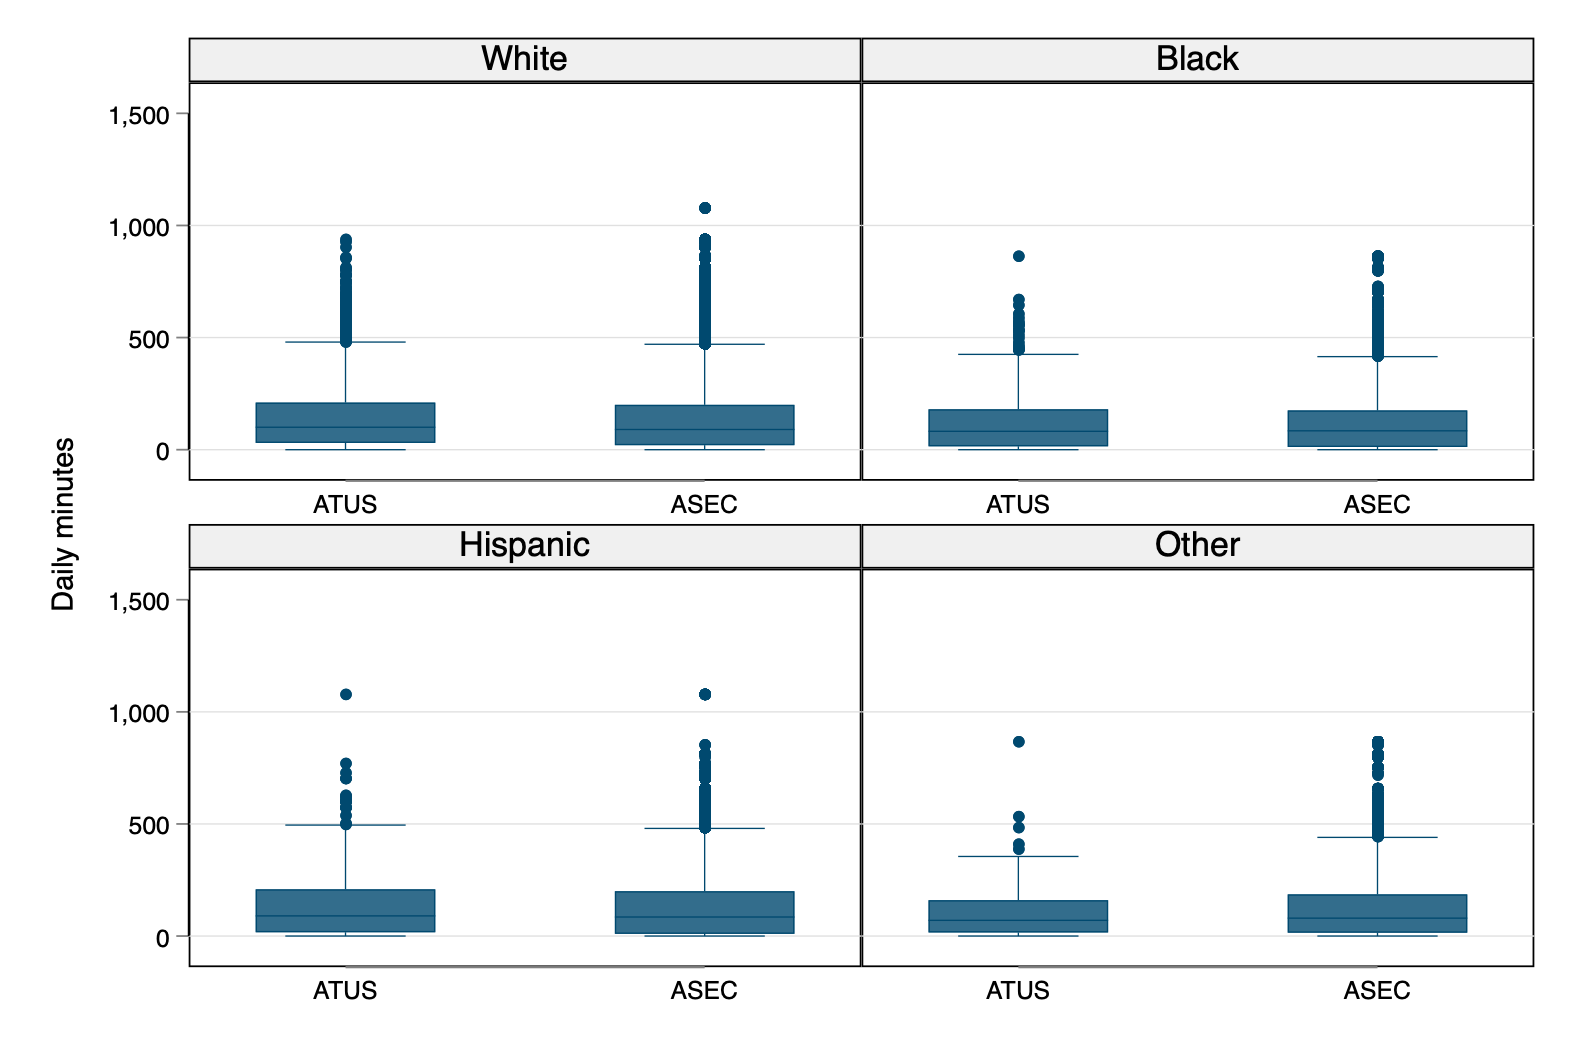
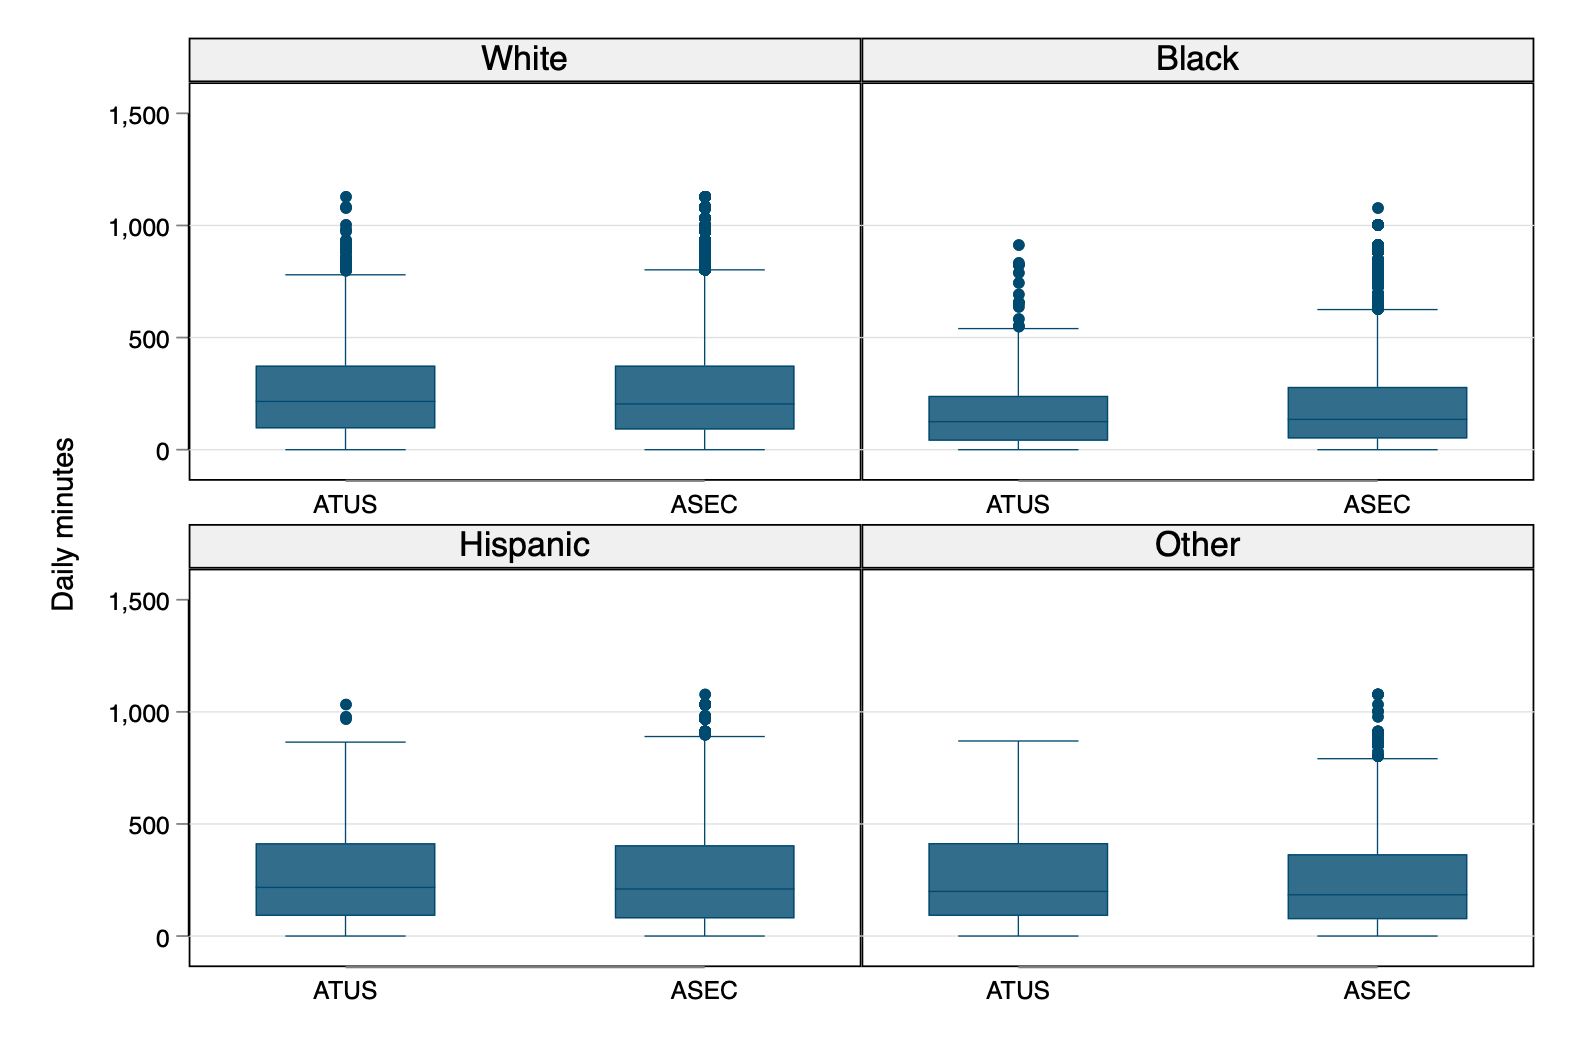
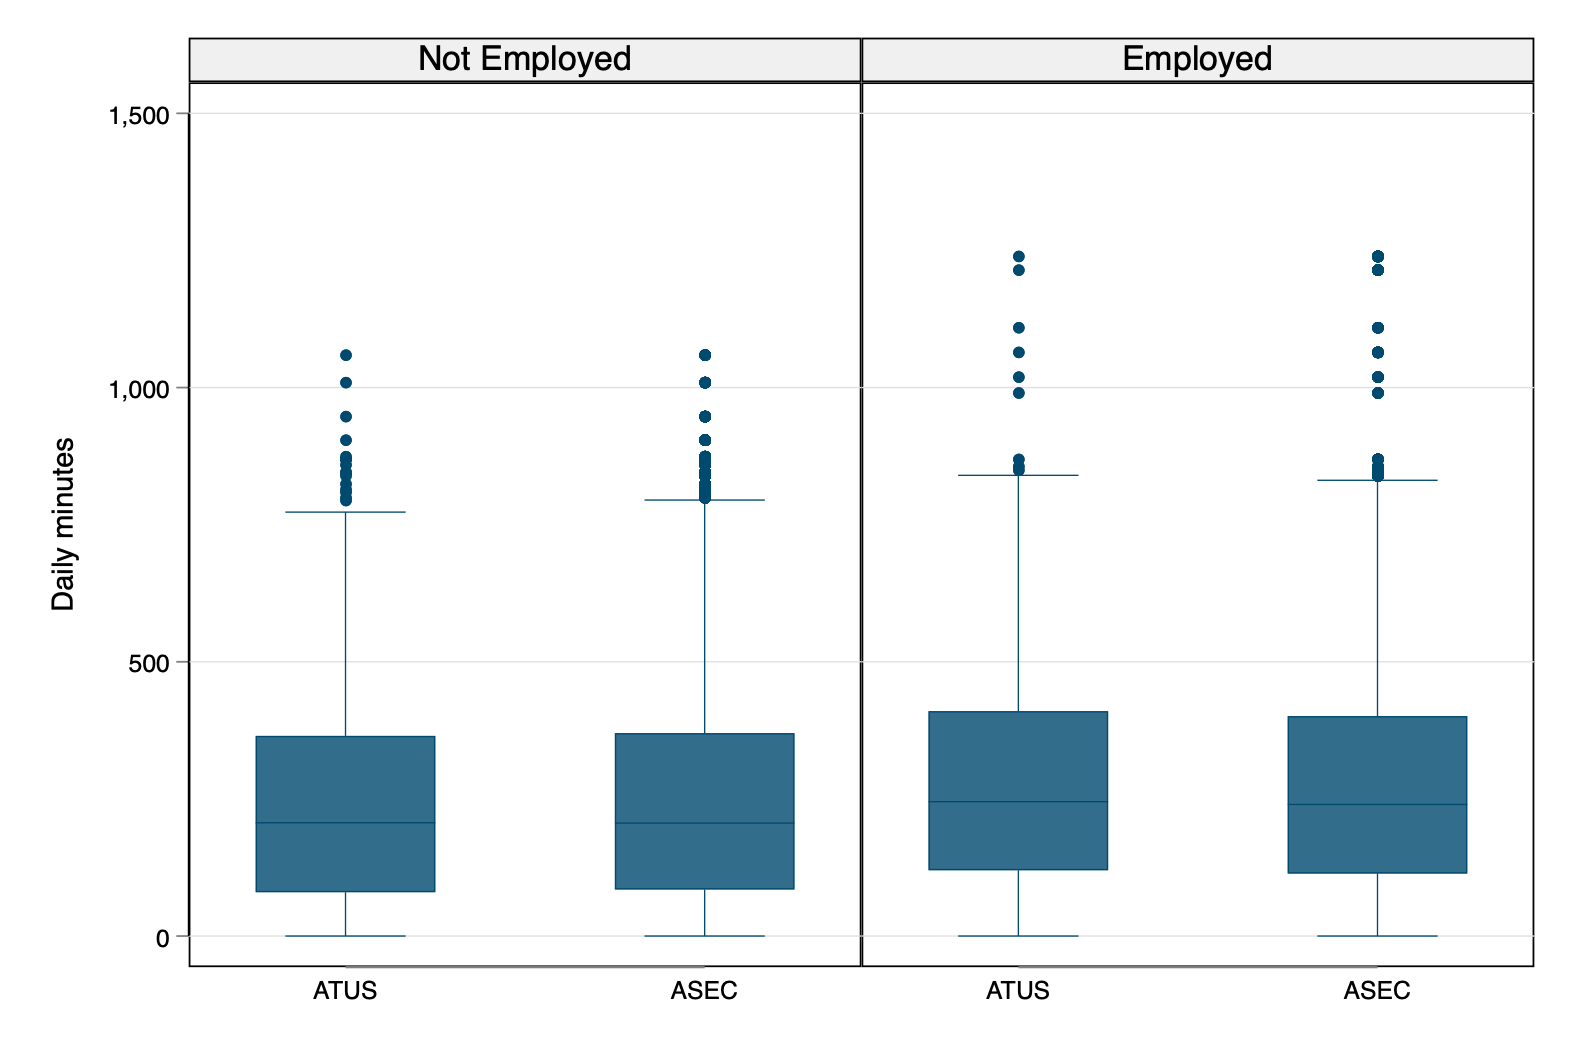
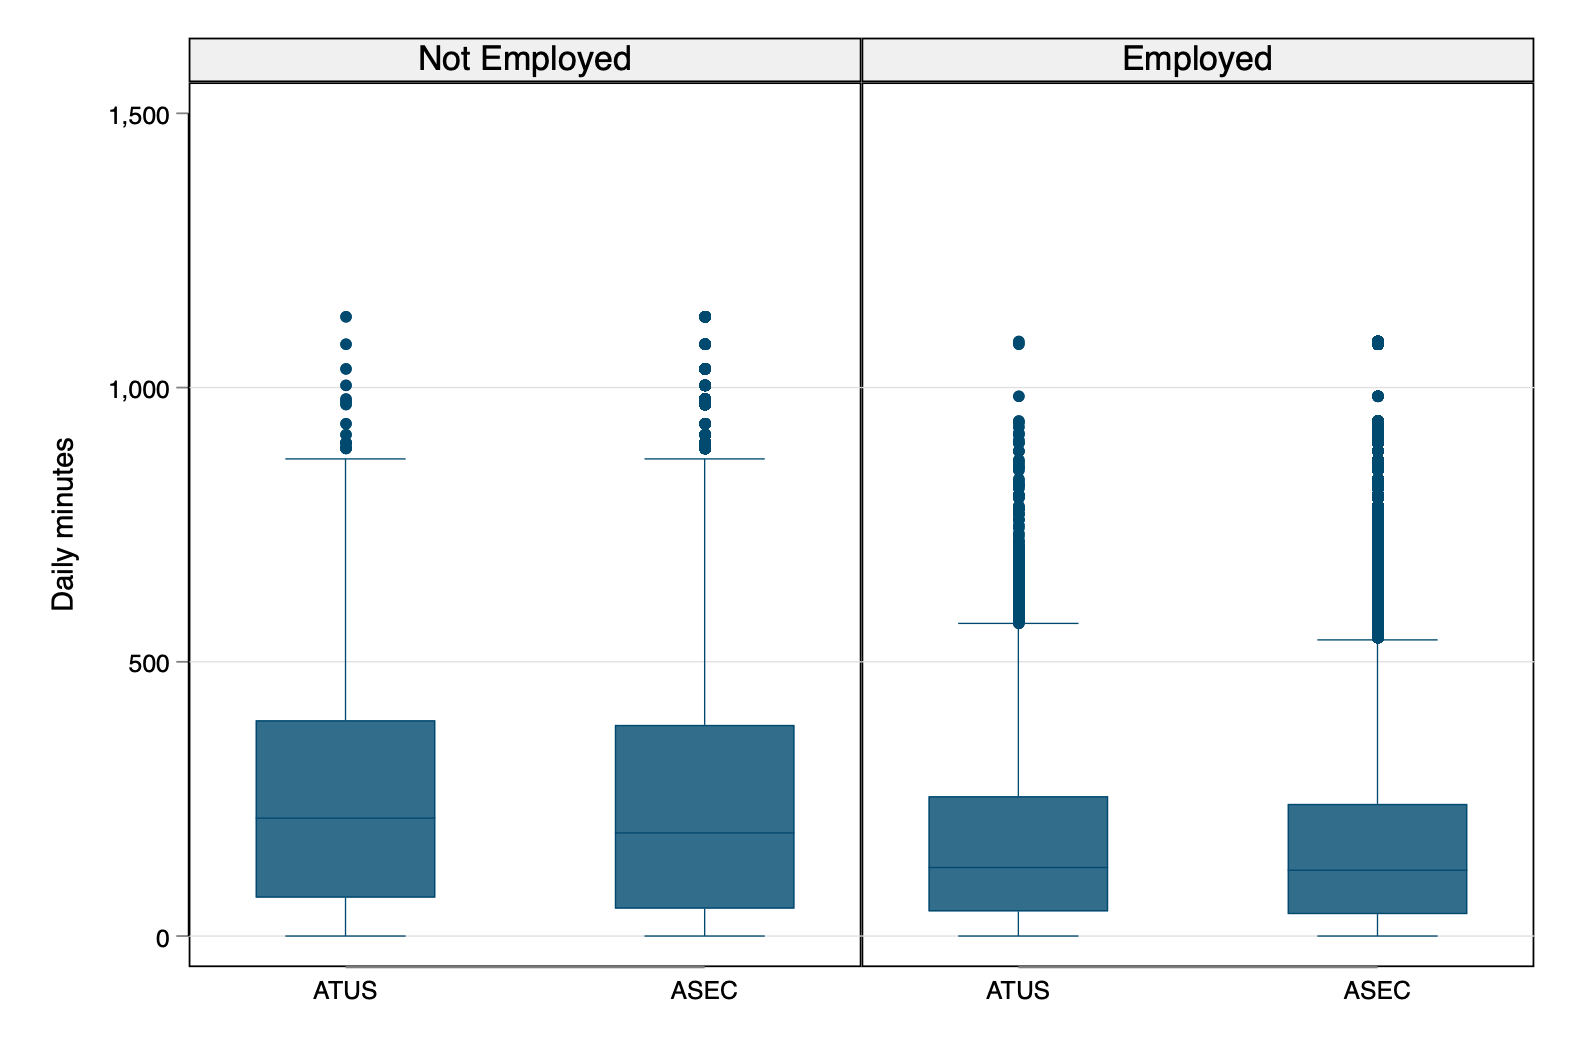
Race
Weekend
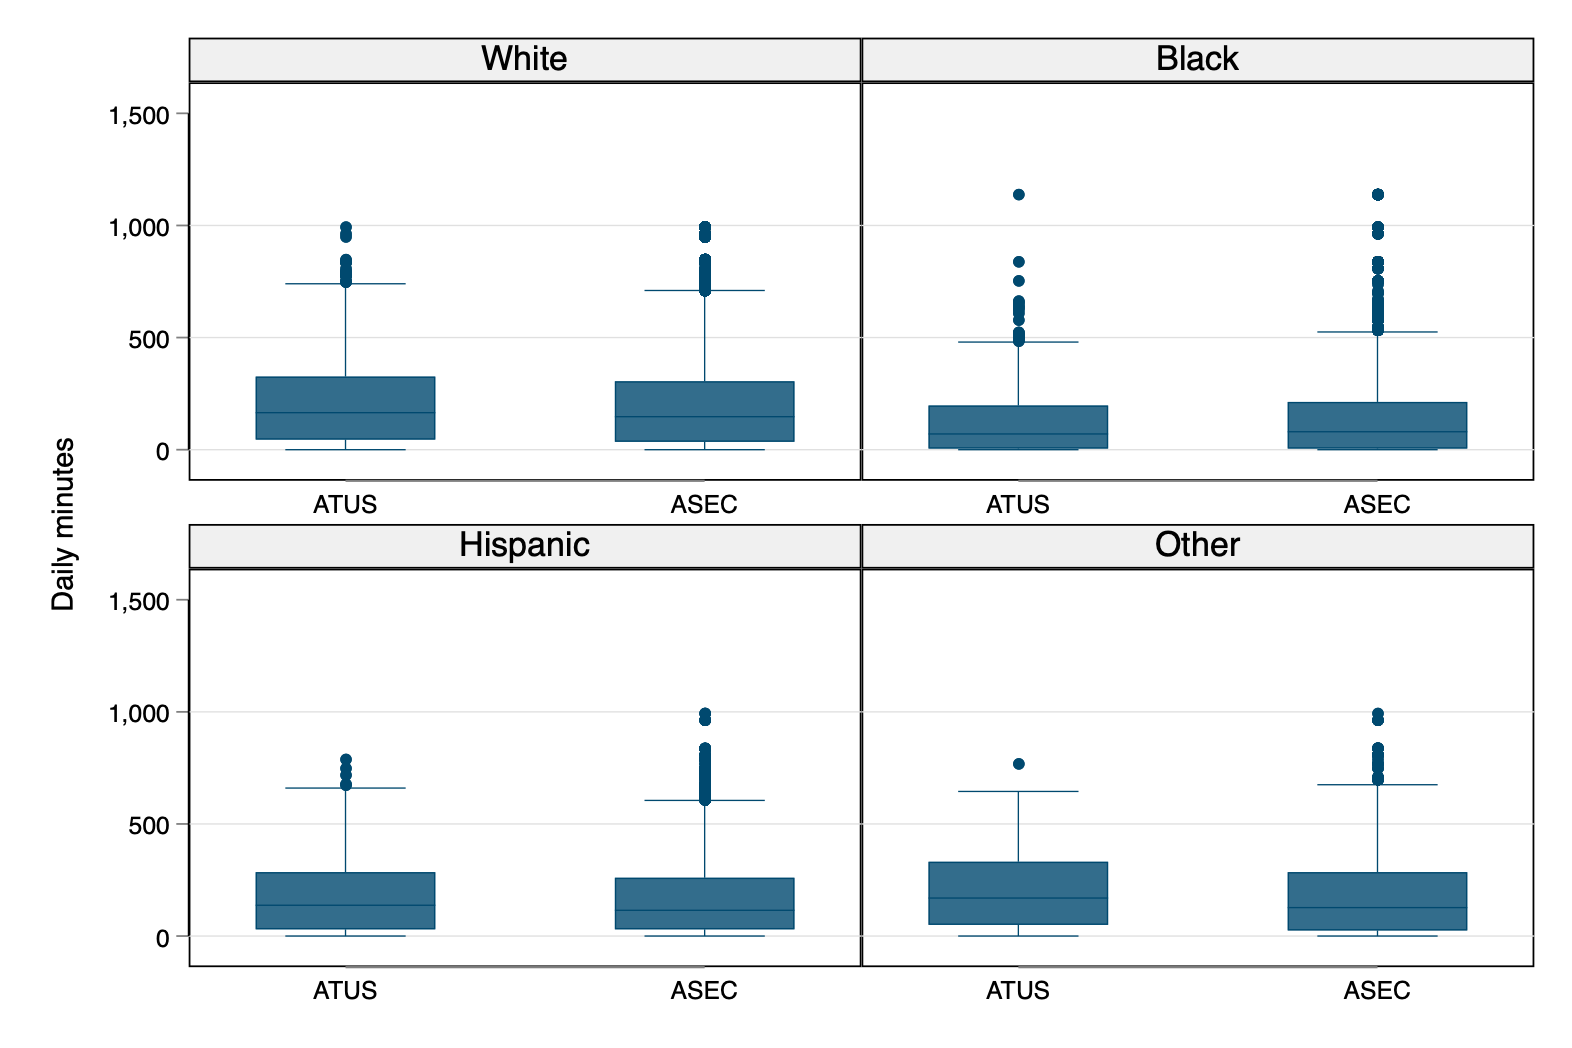
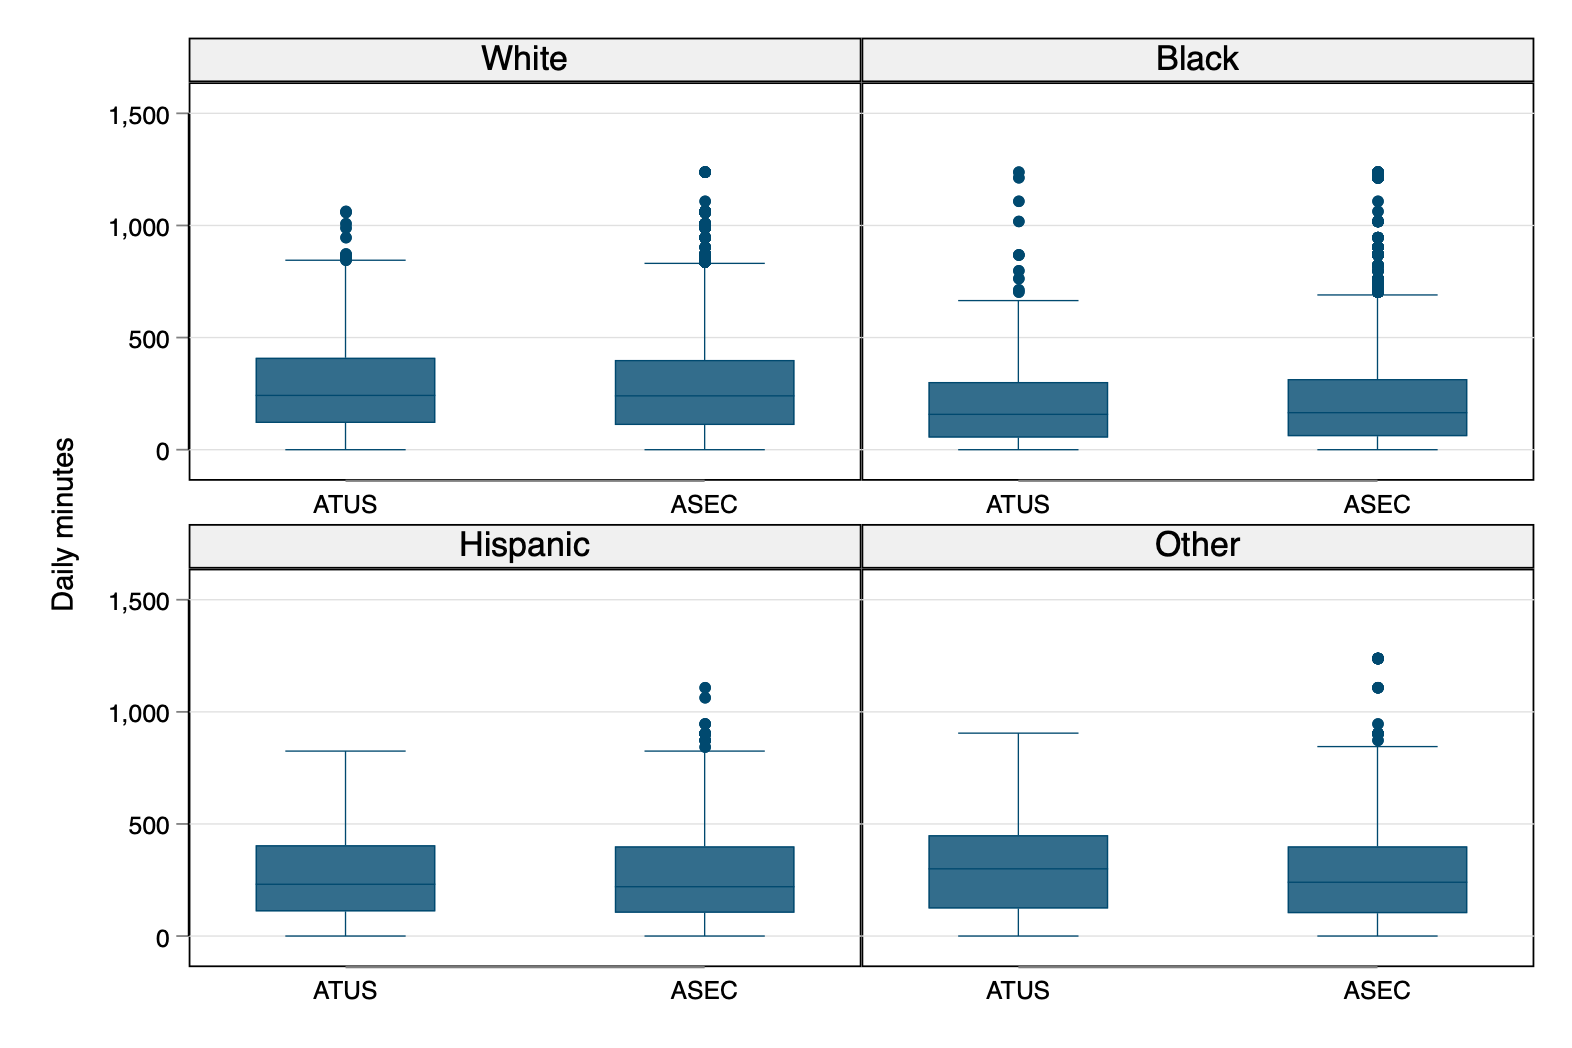
Weekday
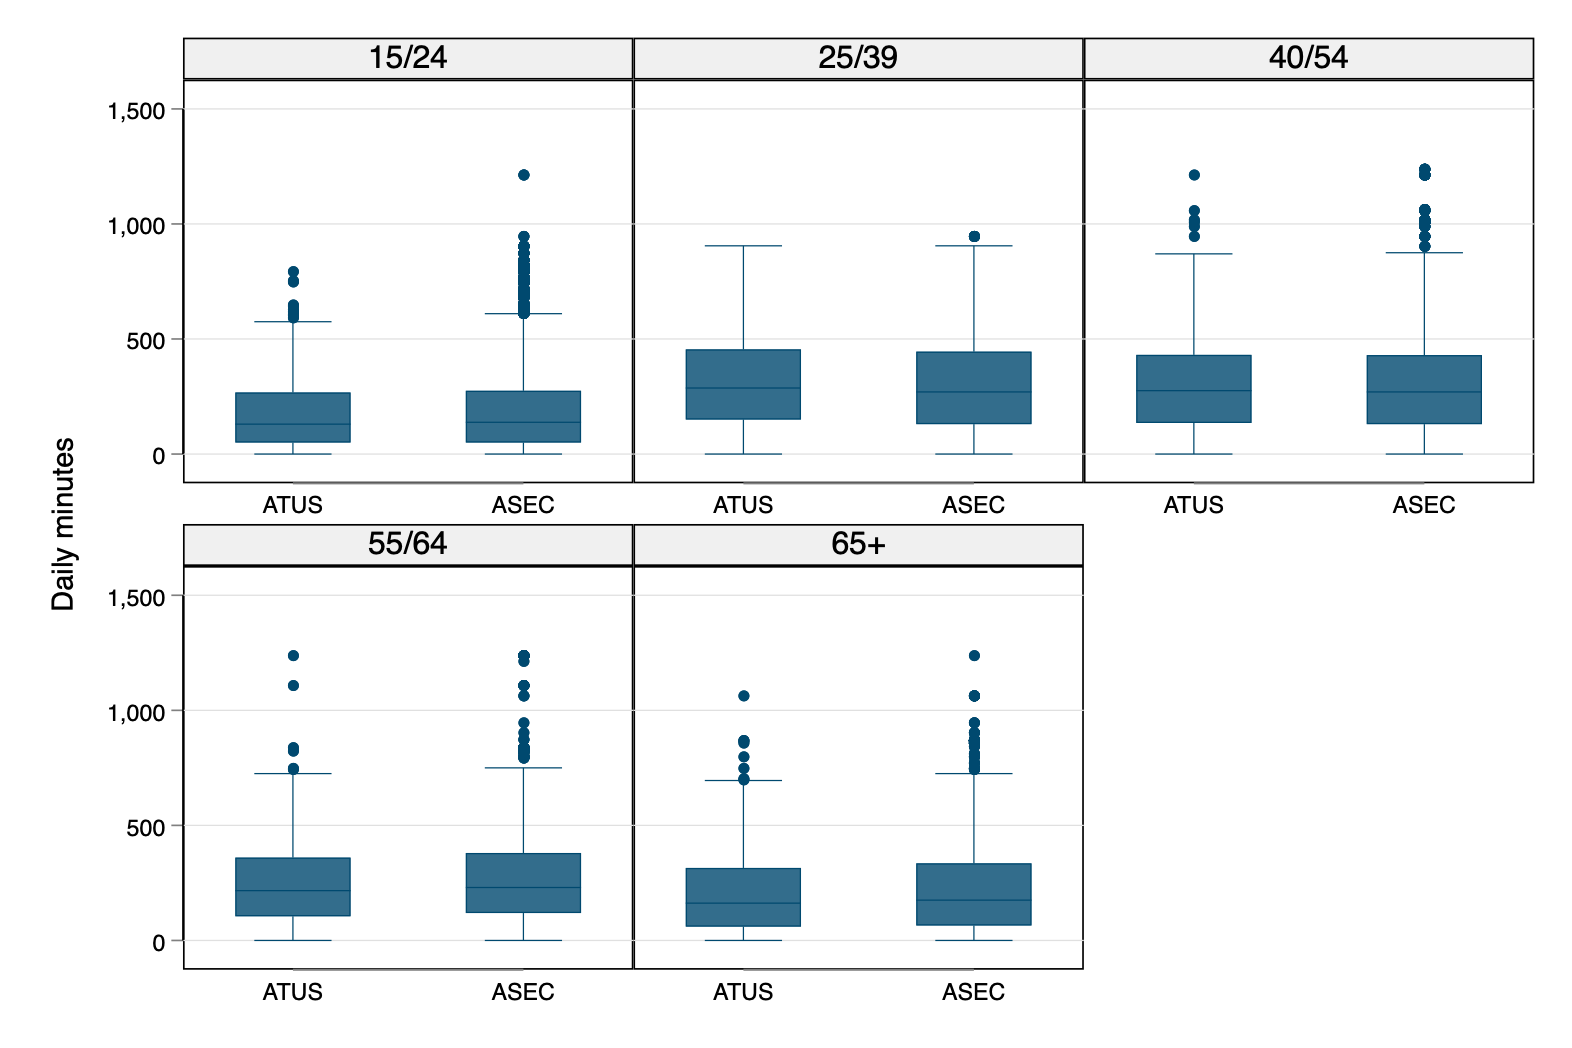
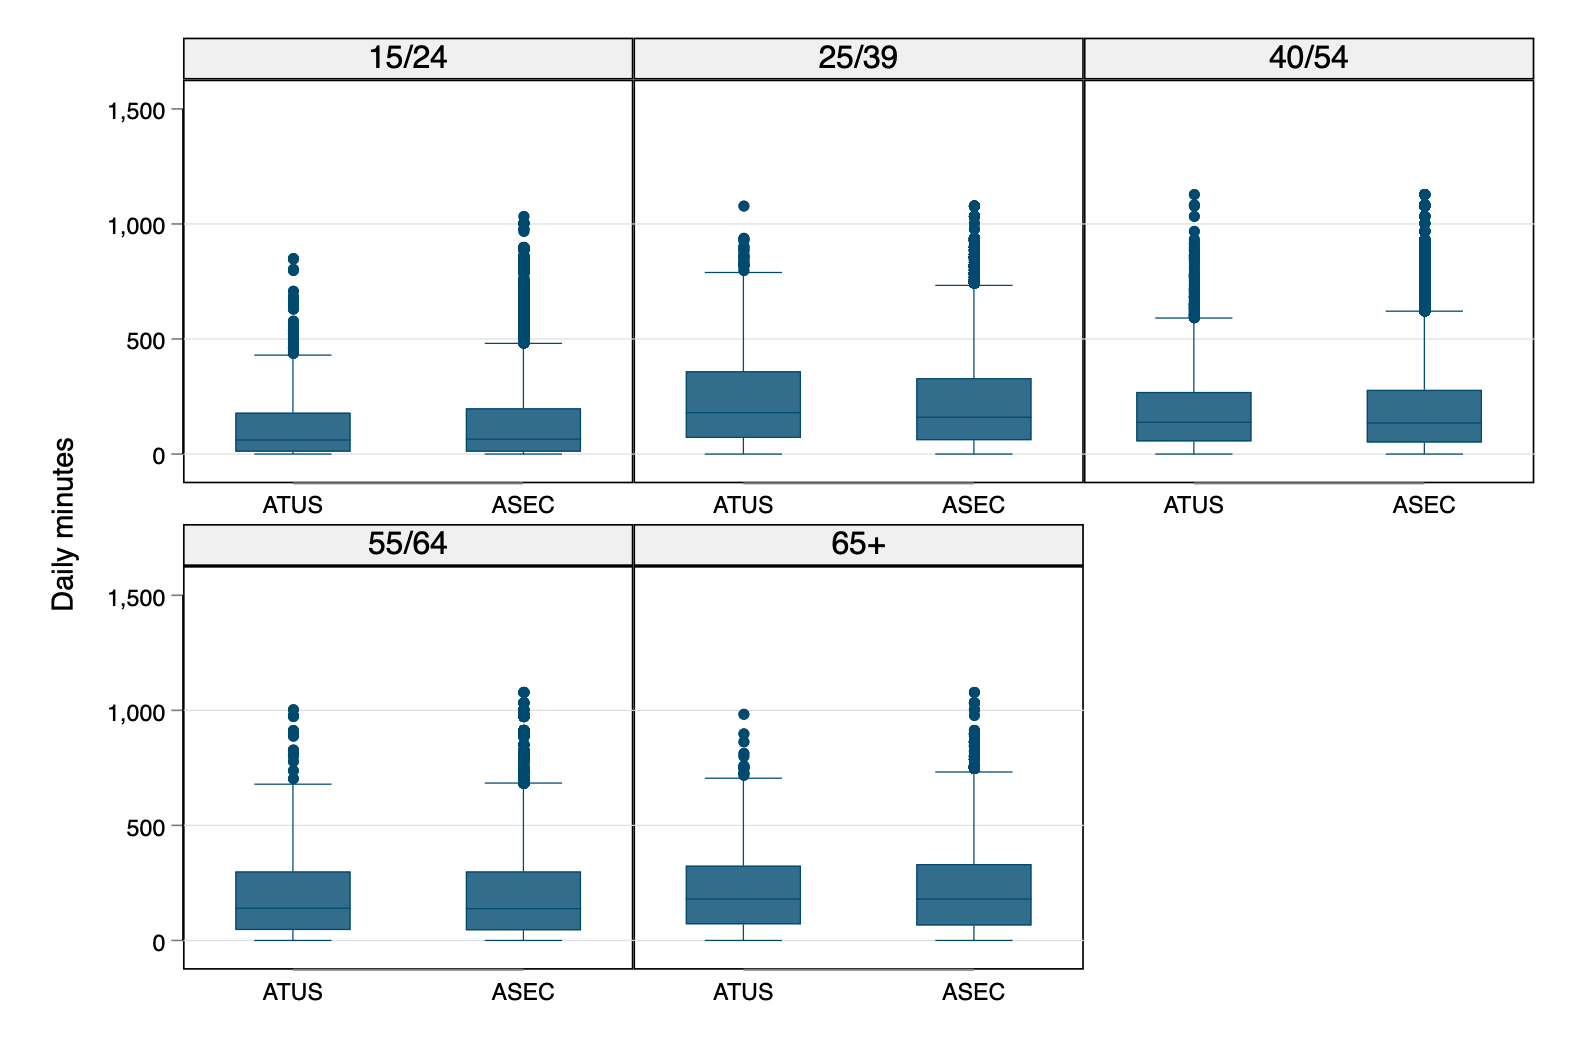
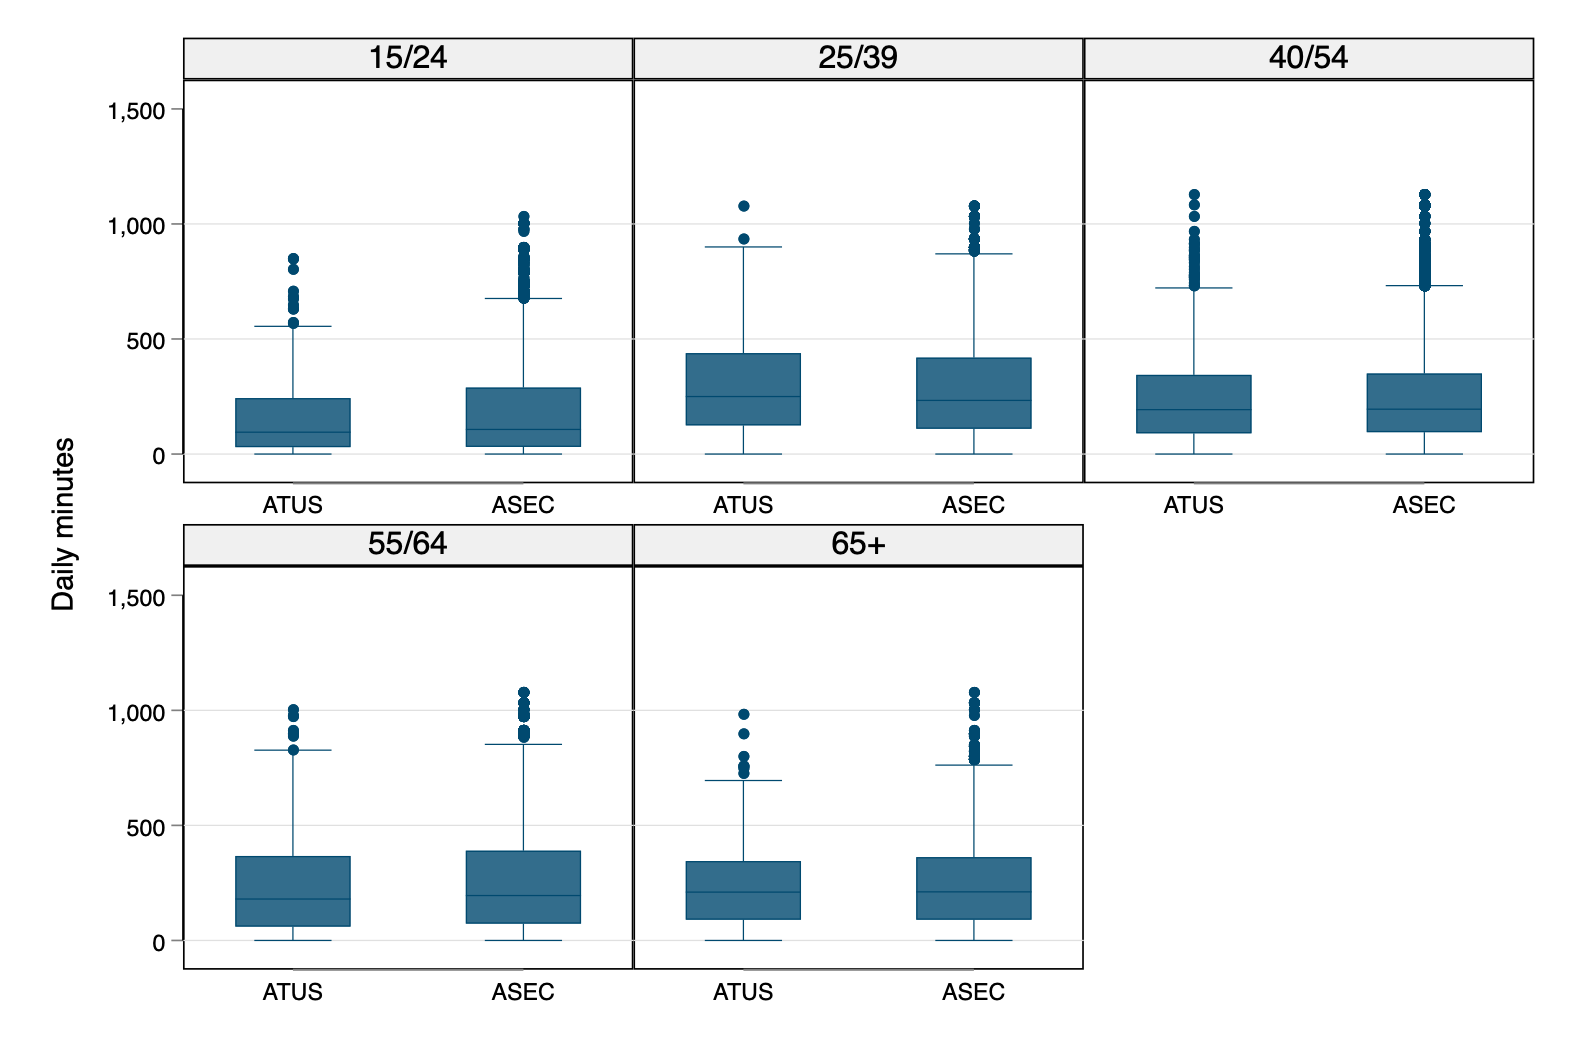
Age Group
Weekend
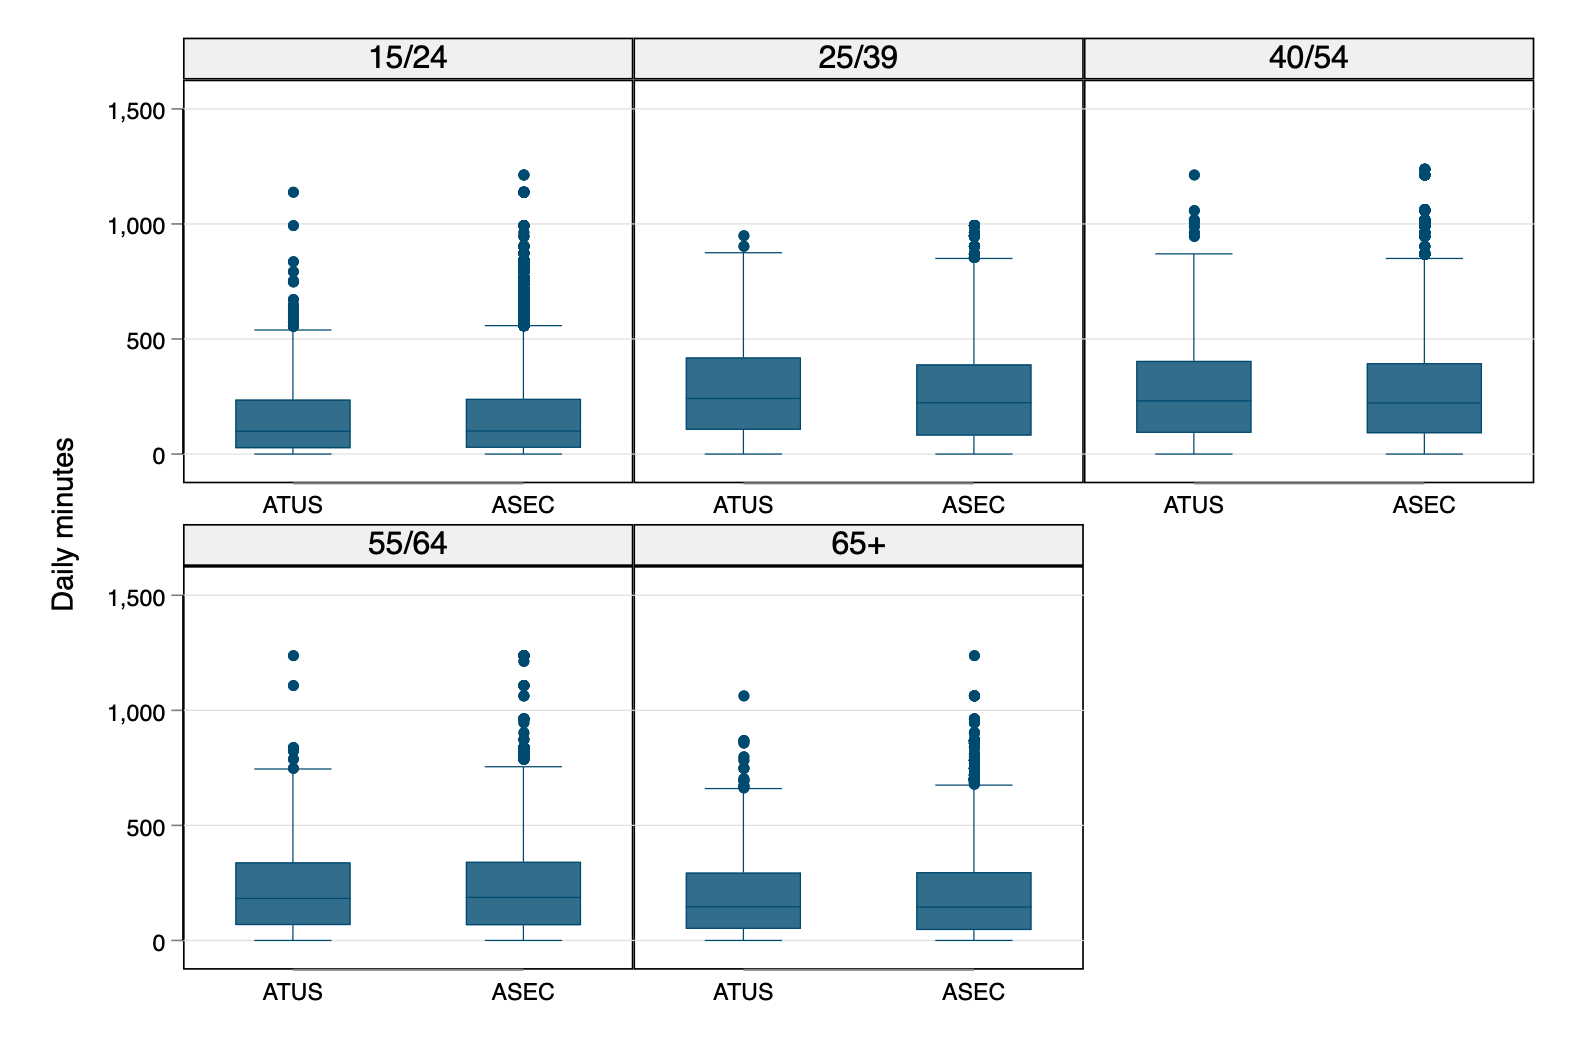

Weekday
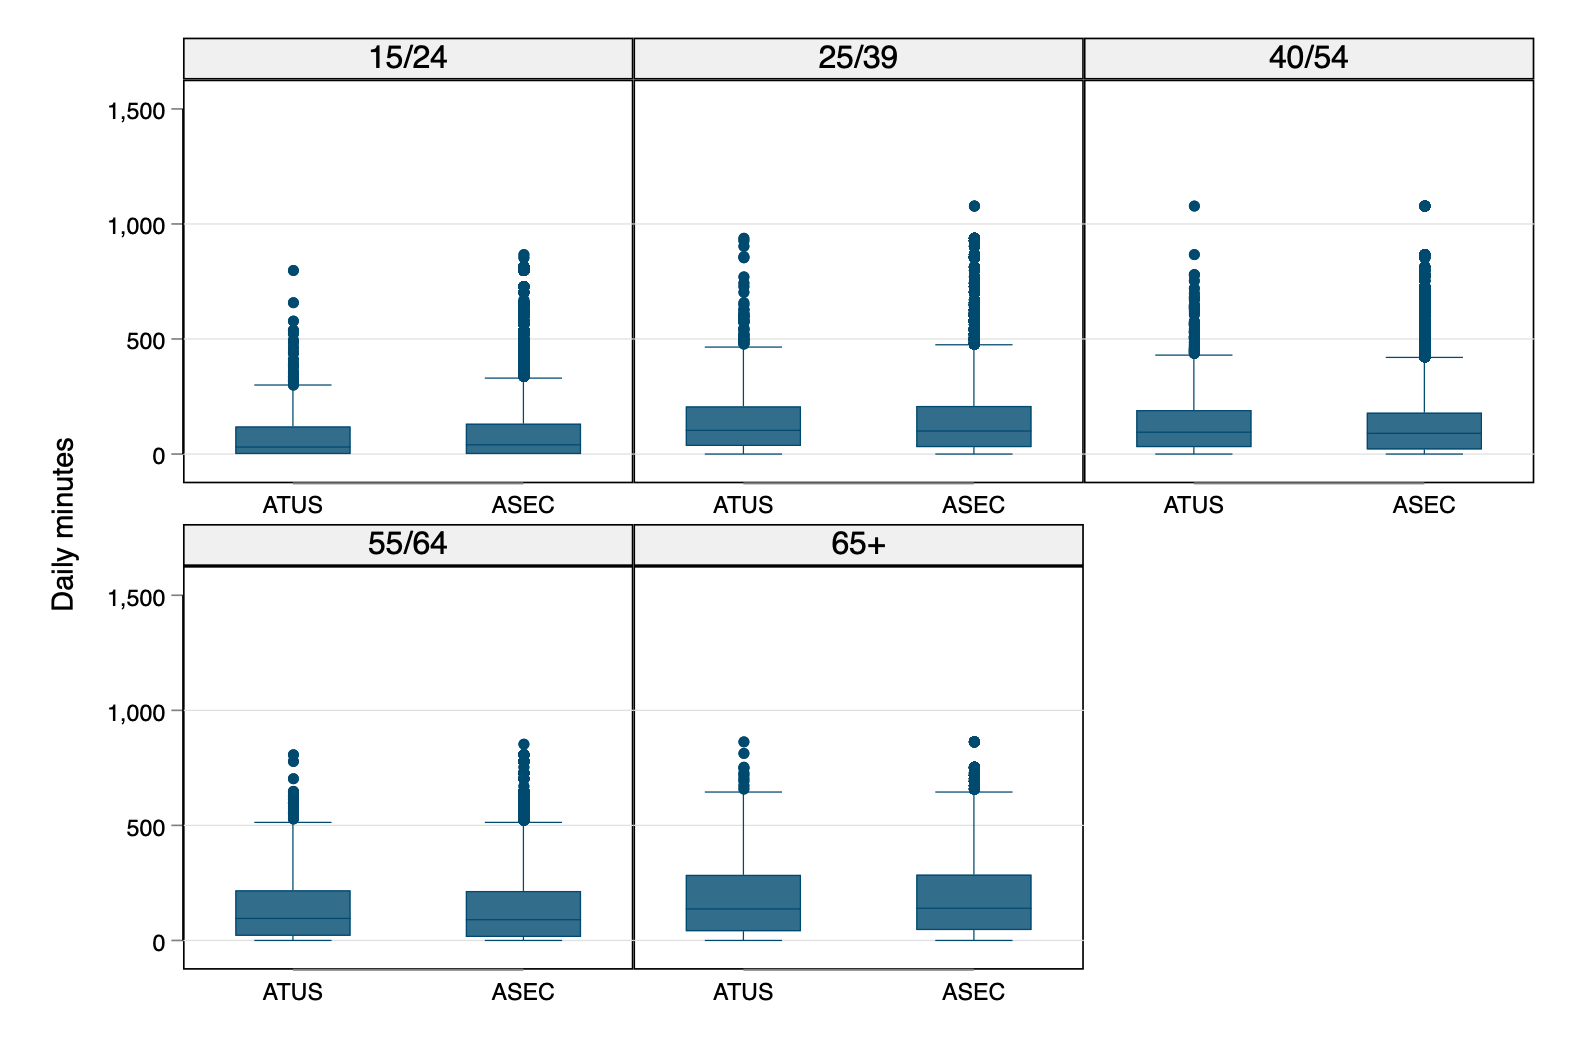
Weekend
Weekday
Young Child
Weekend
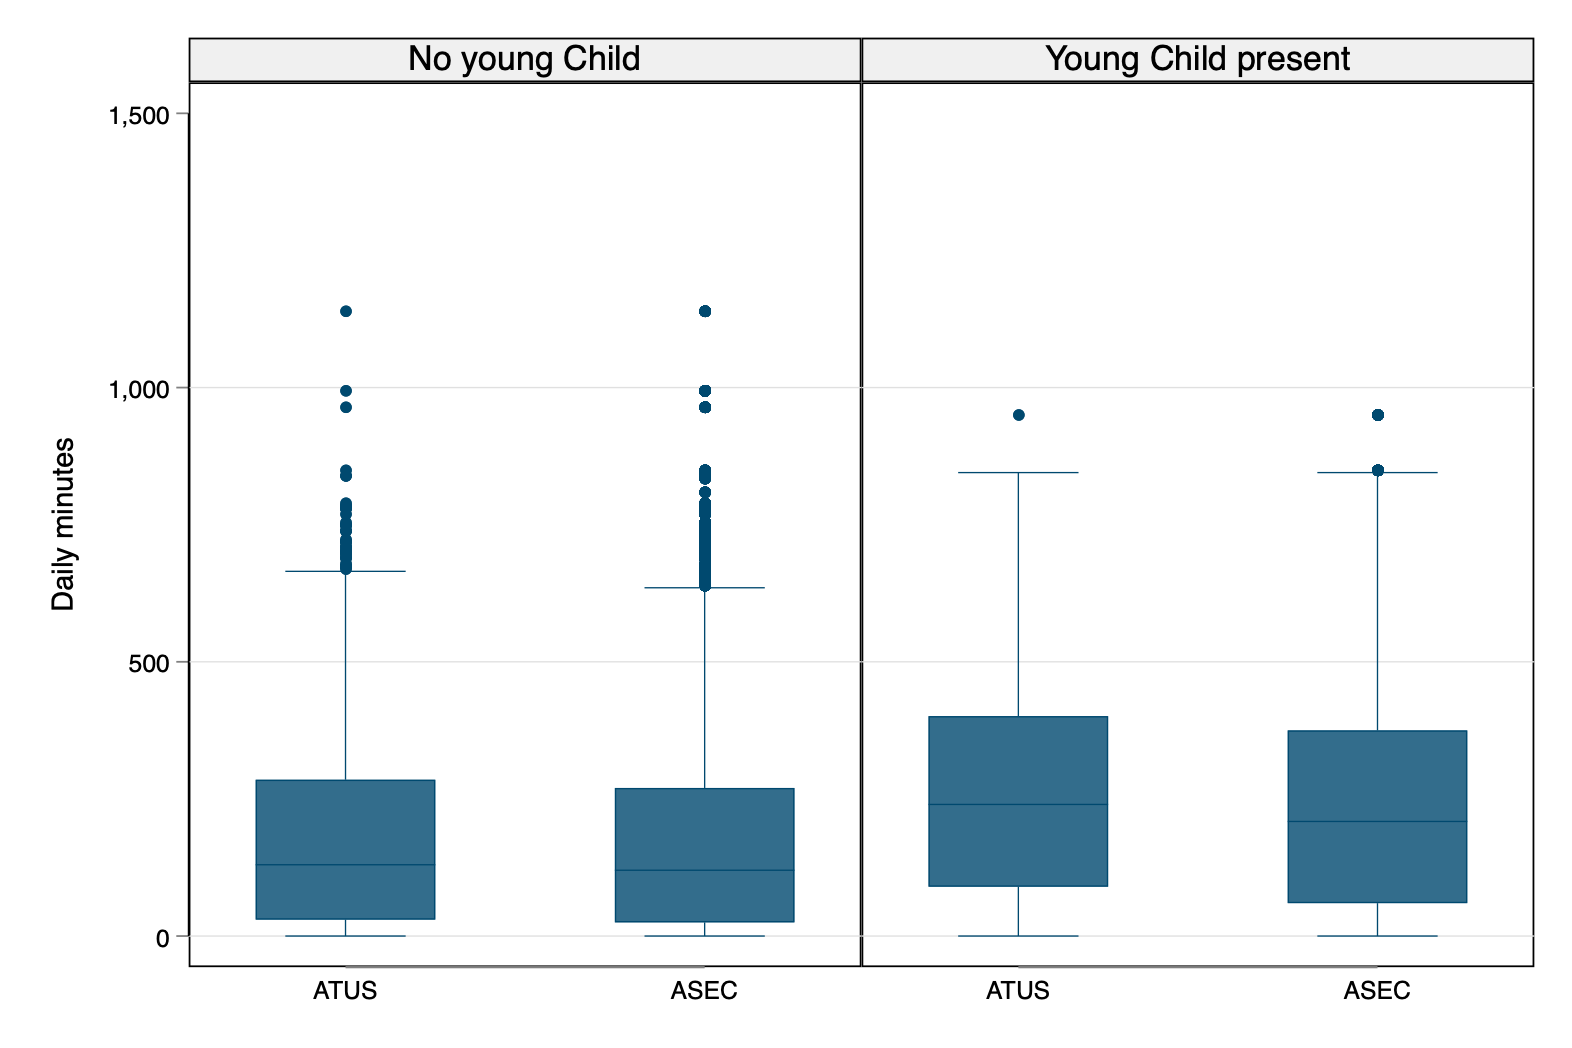
Weekday
# Children
Weekend
Weekday
# Adults
Weekend

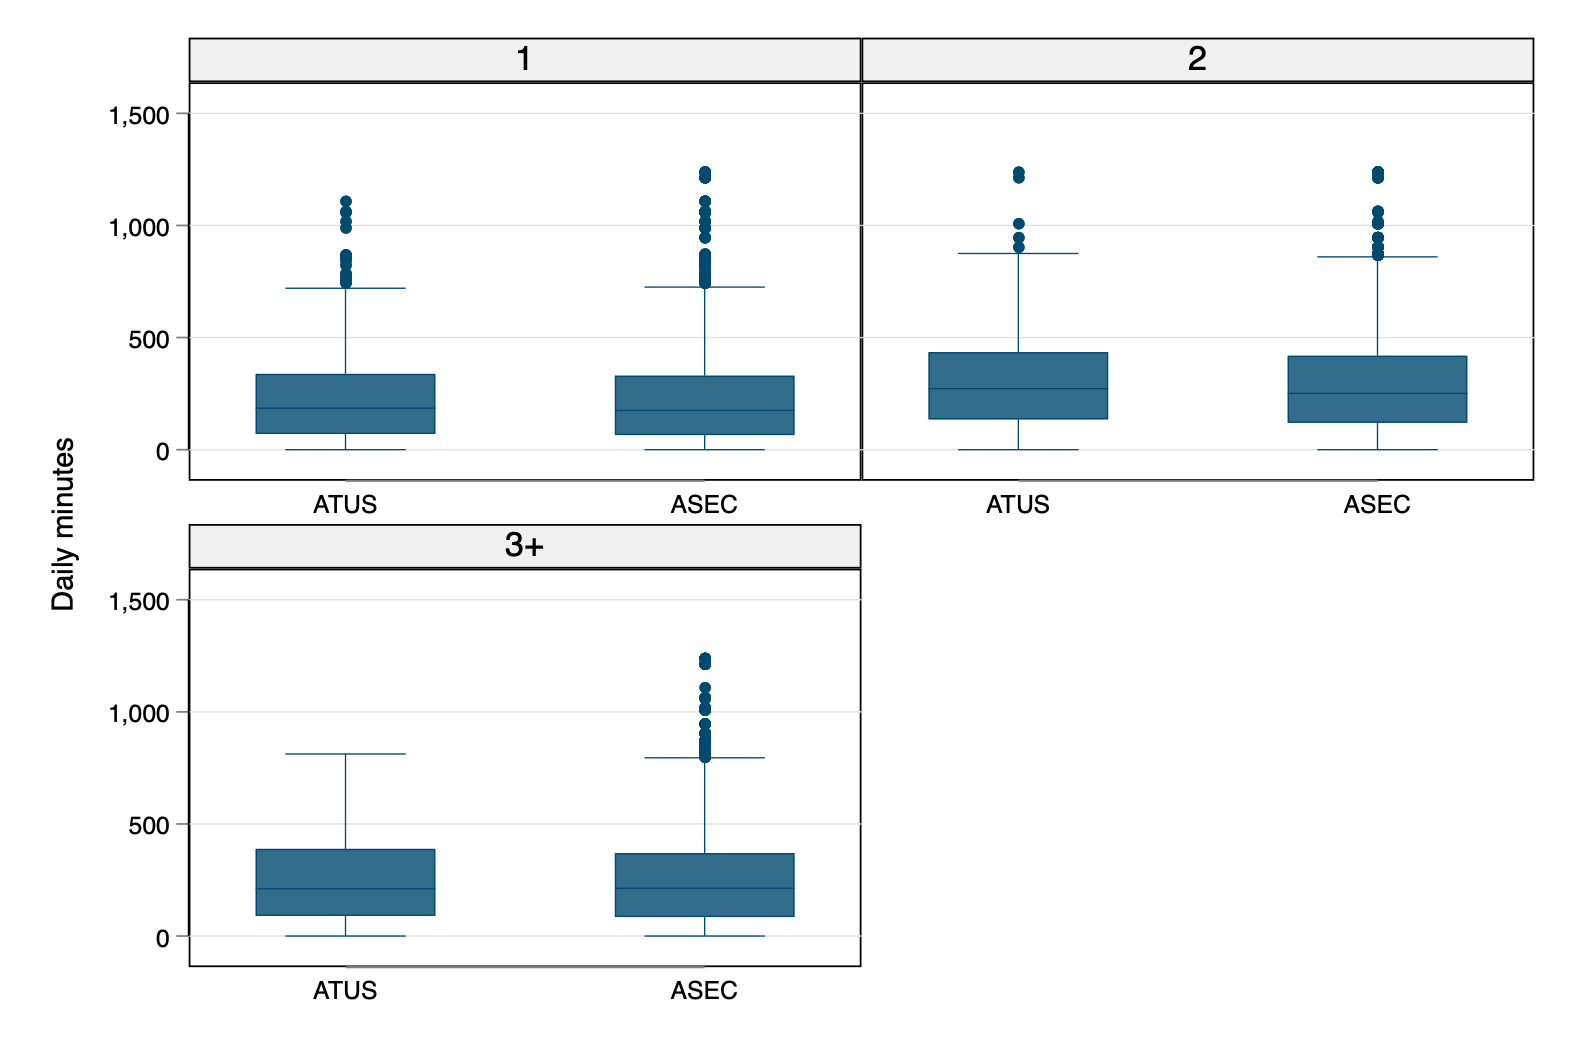
Weekday
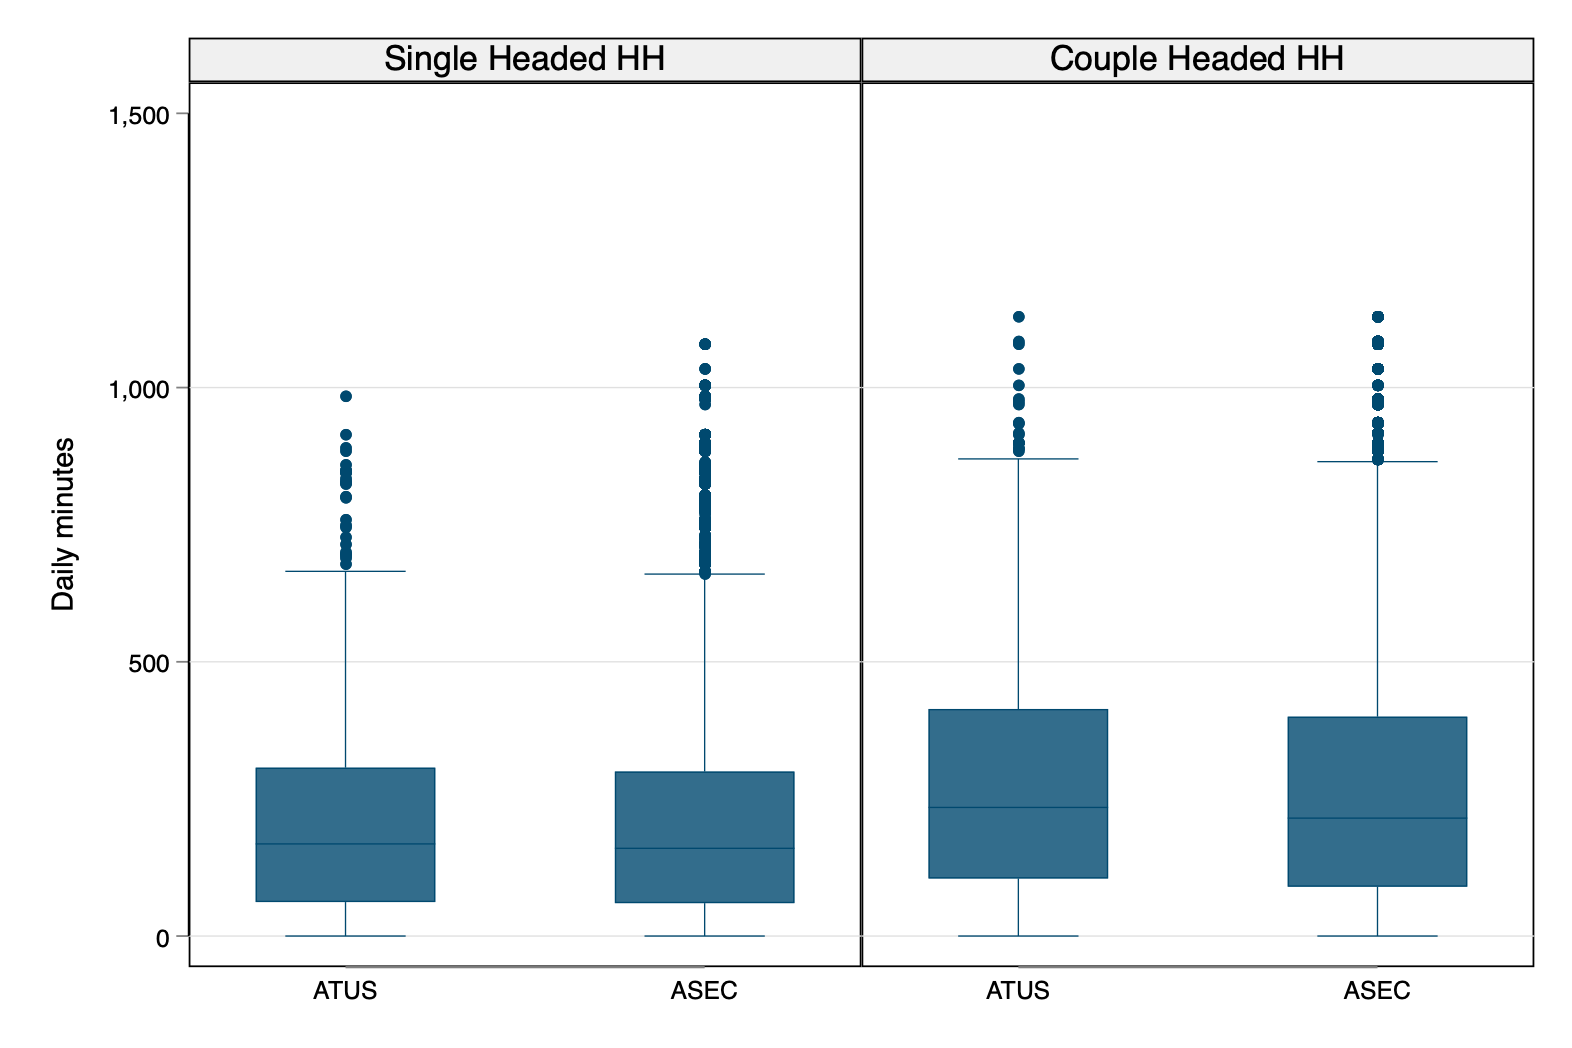
Couple
Weekend
Weekday
Education
Weekend
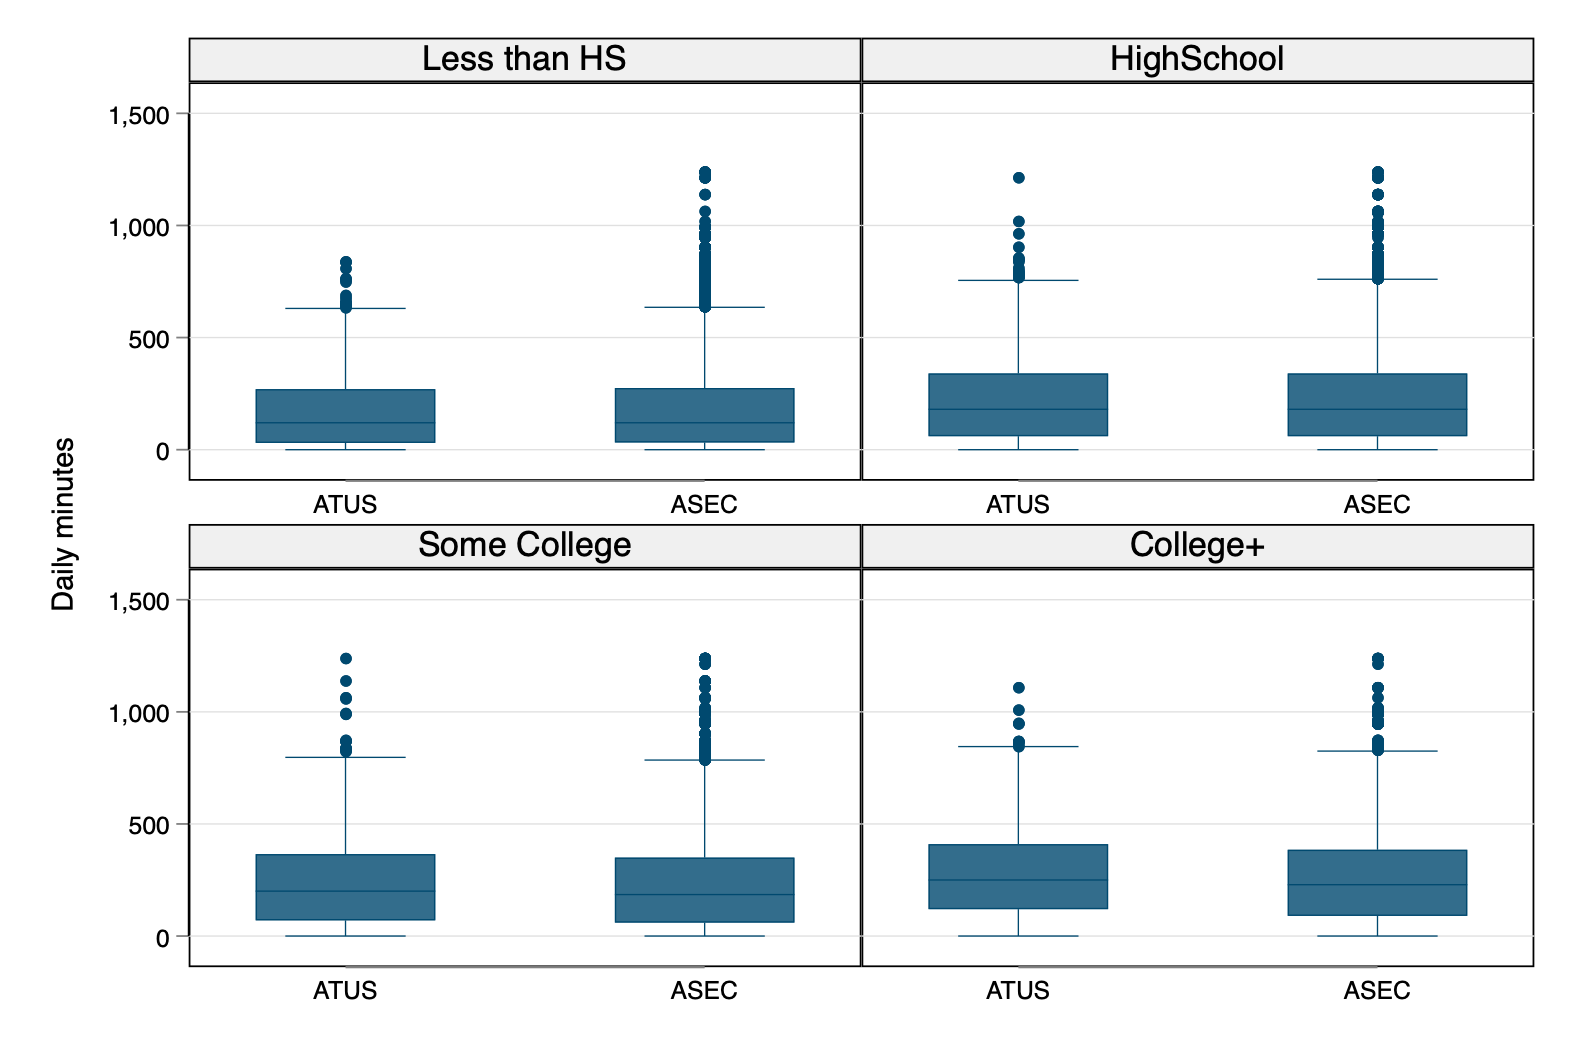
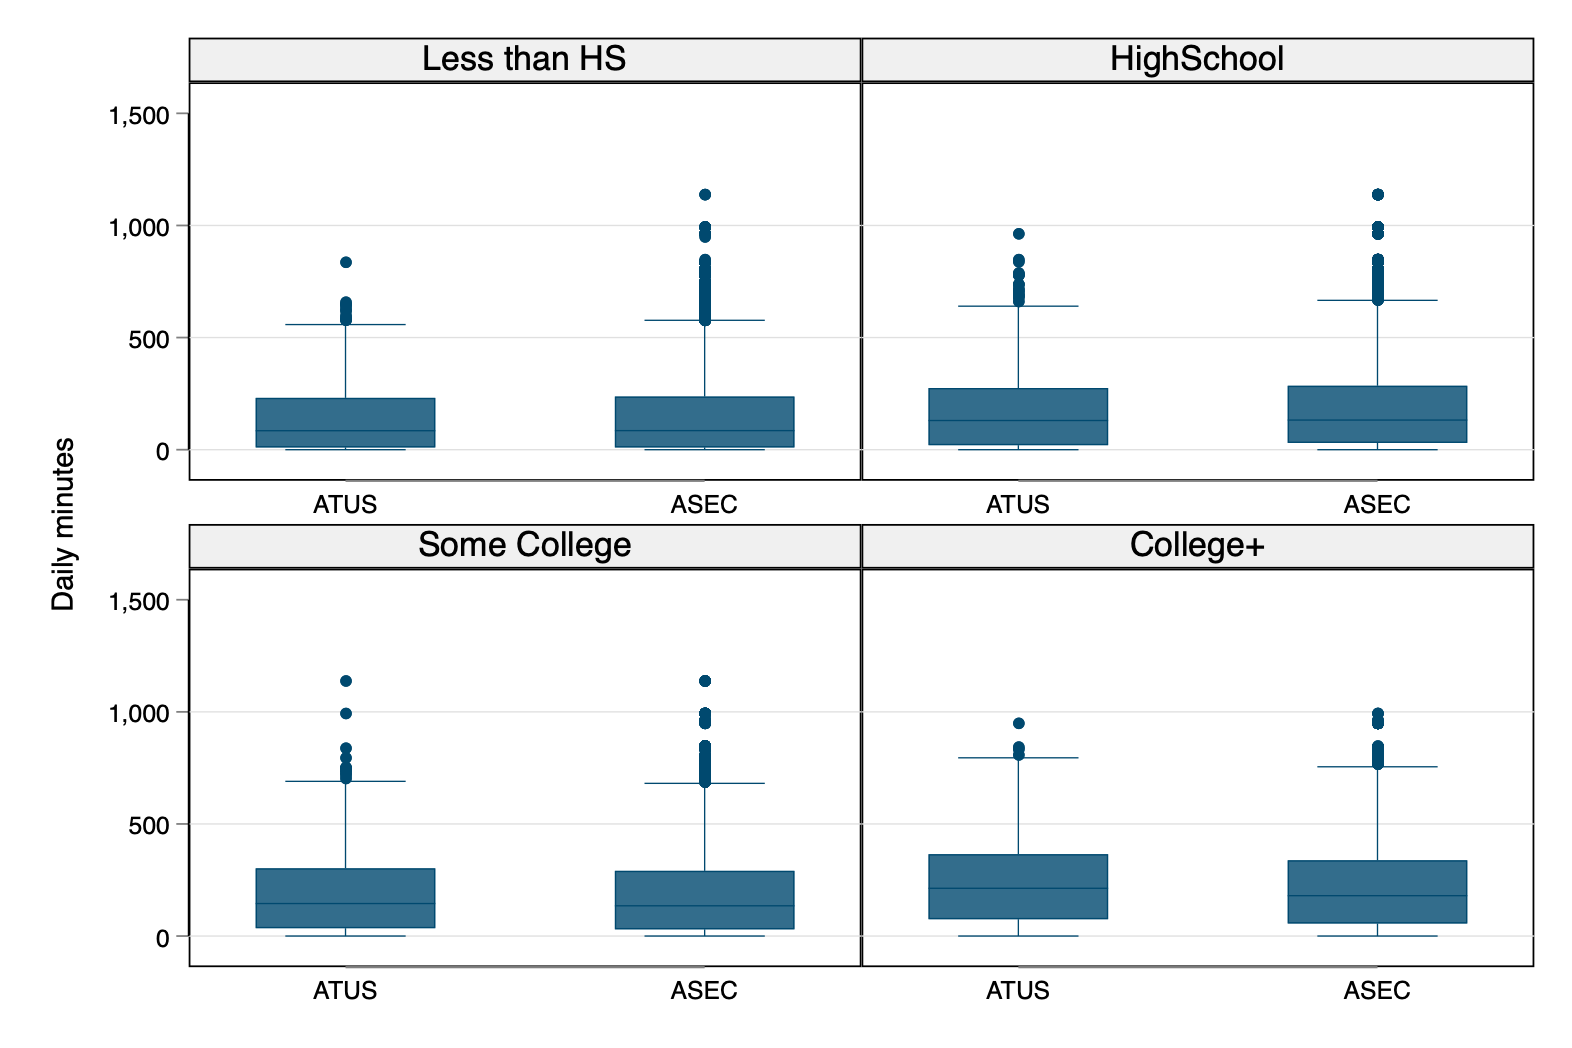
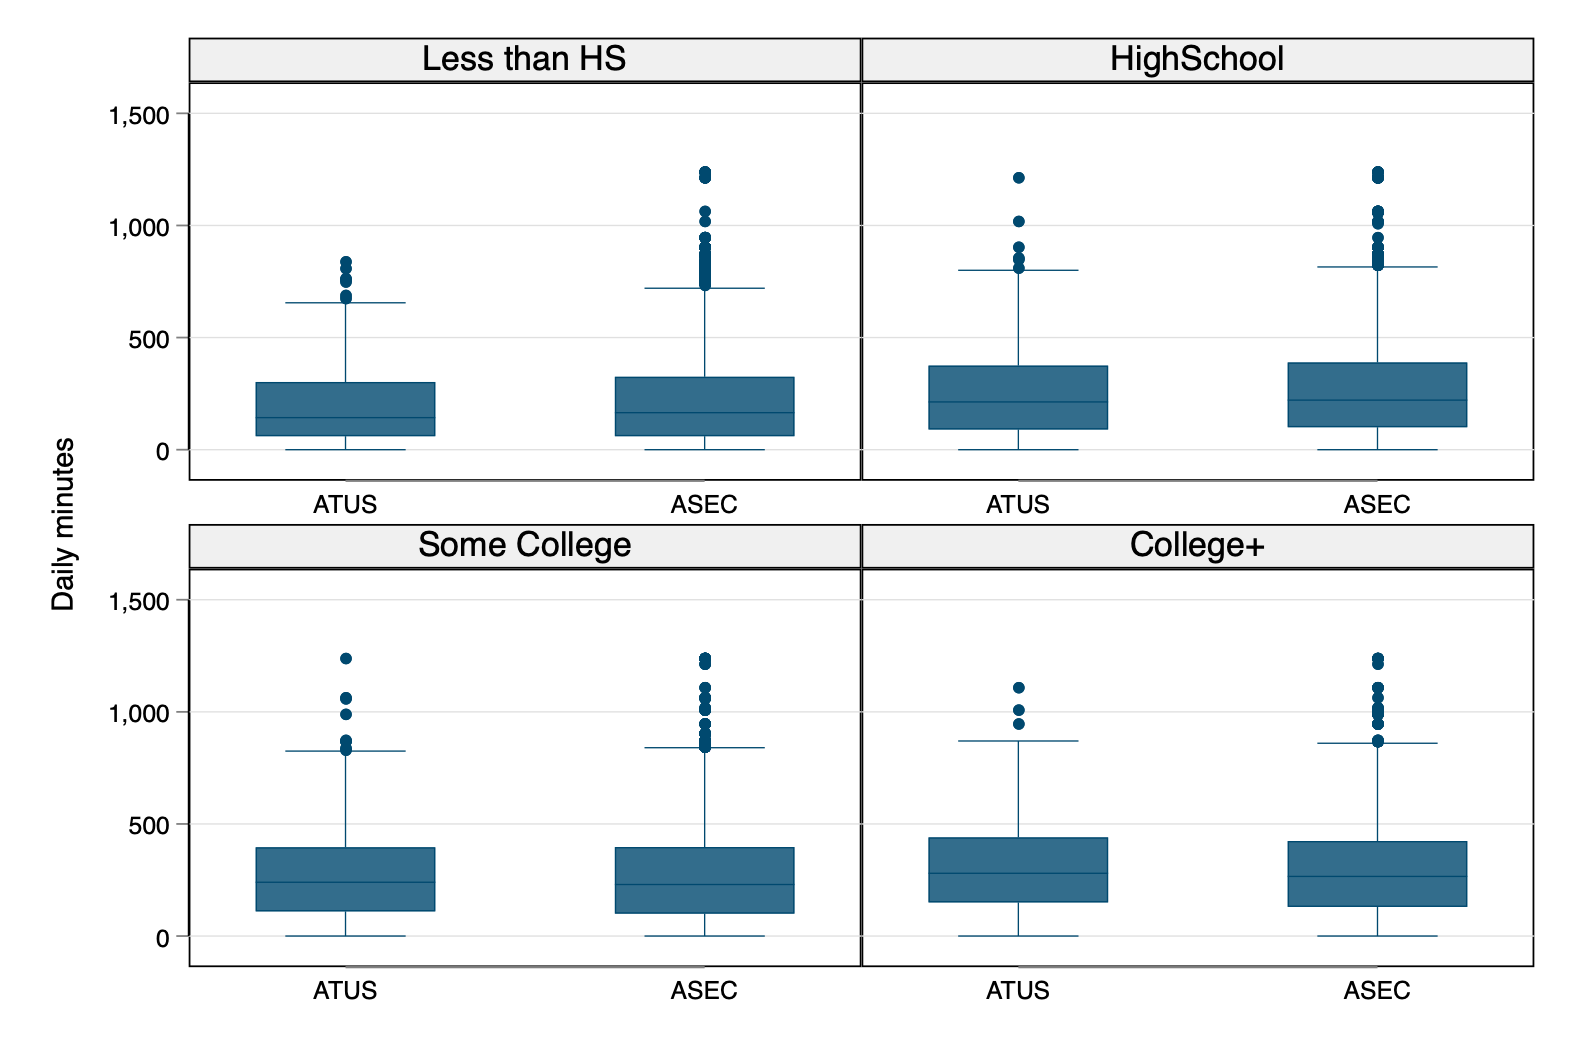
Weekday
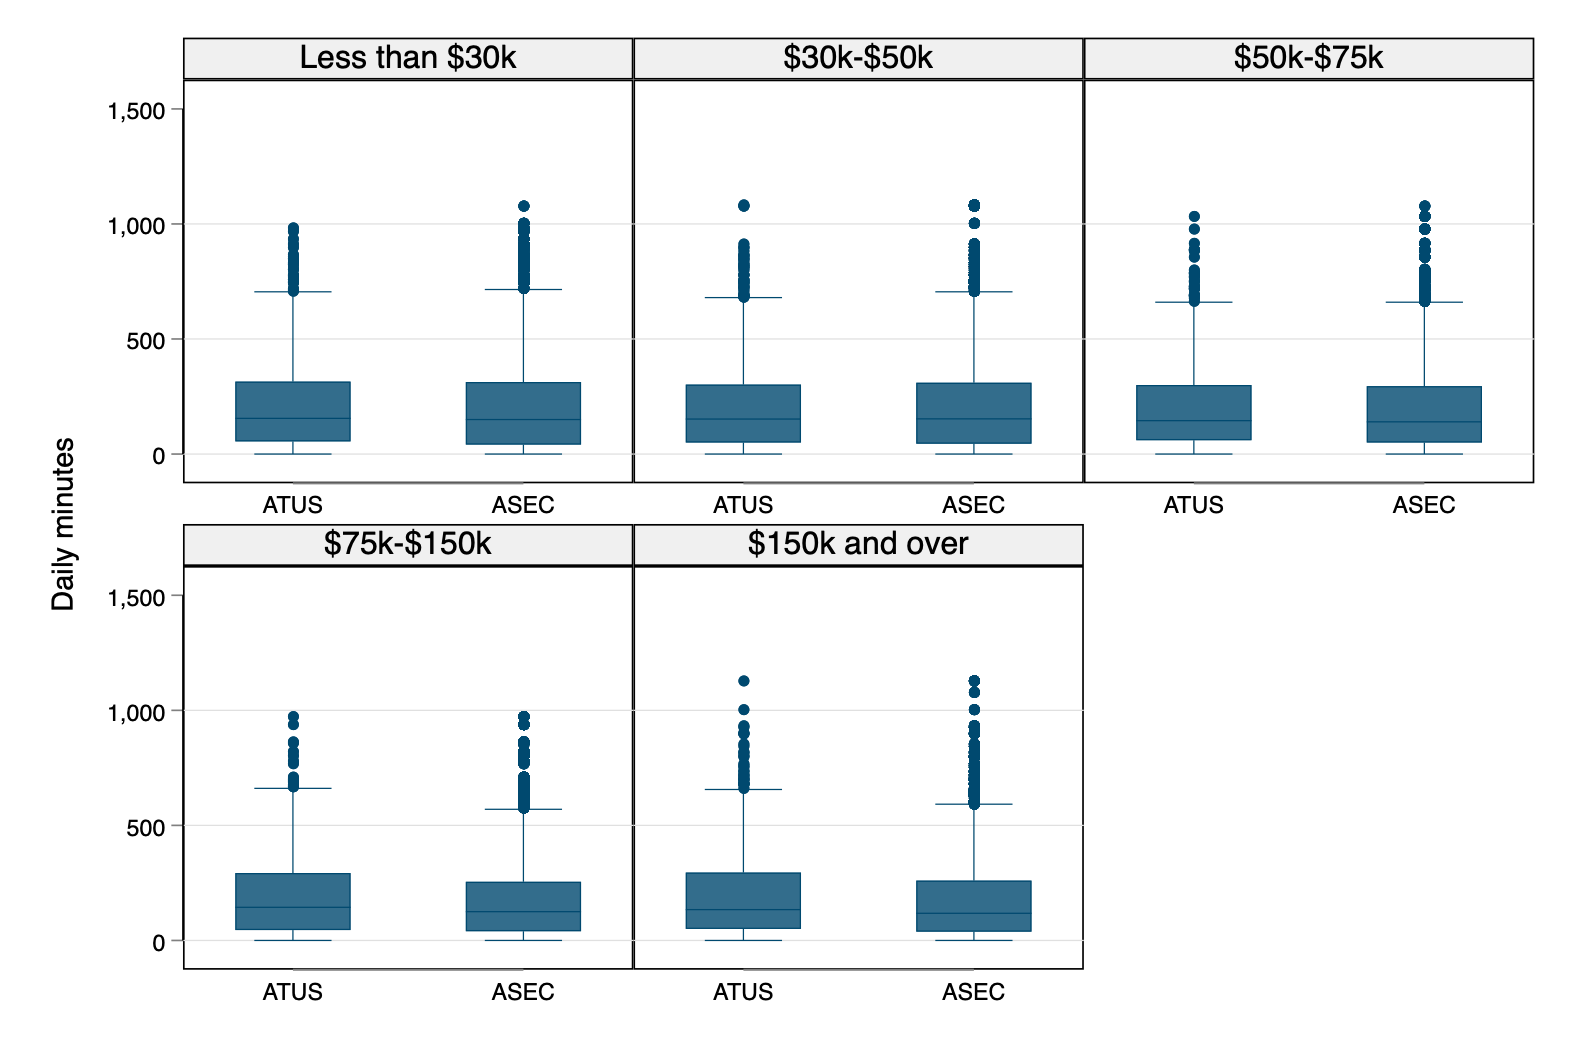
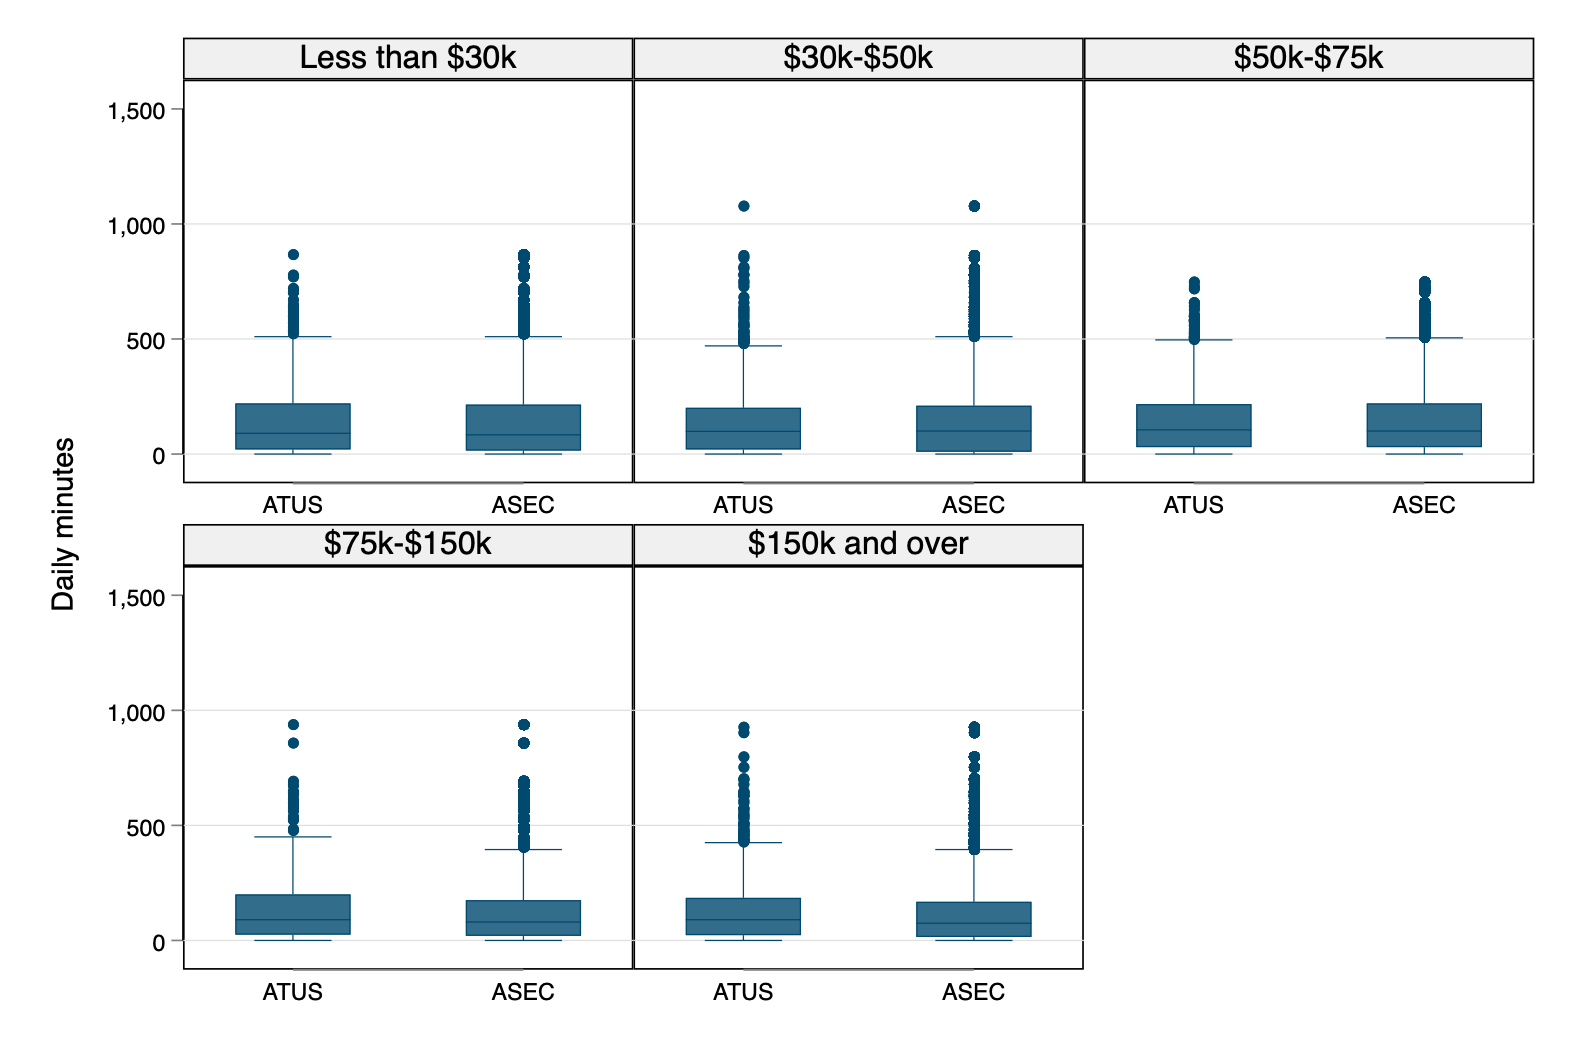
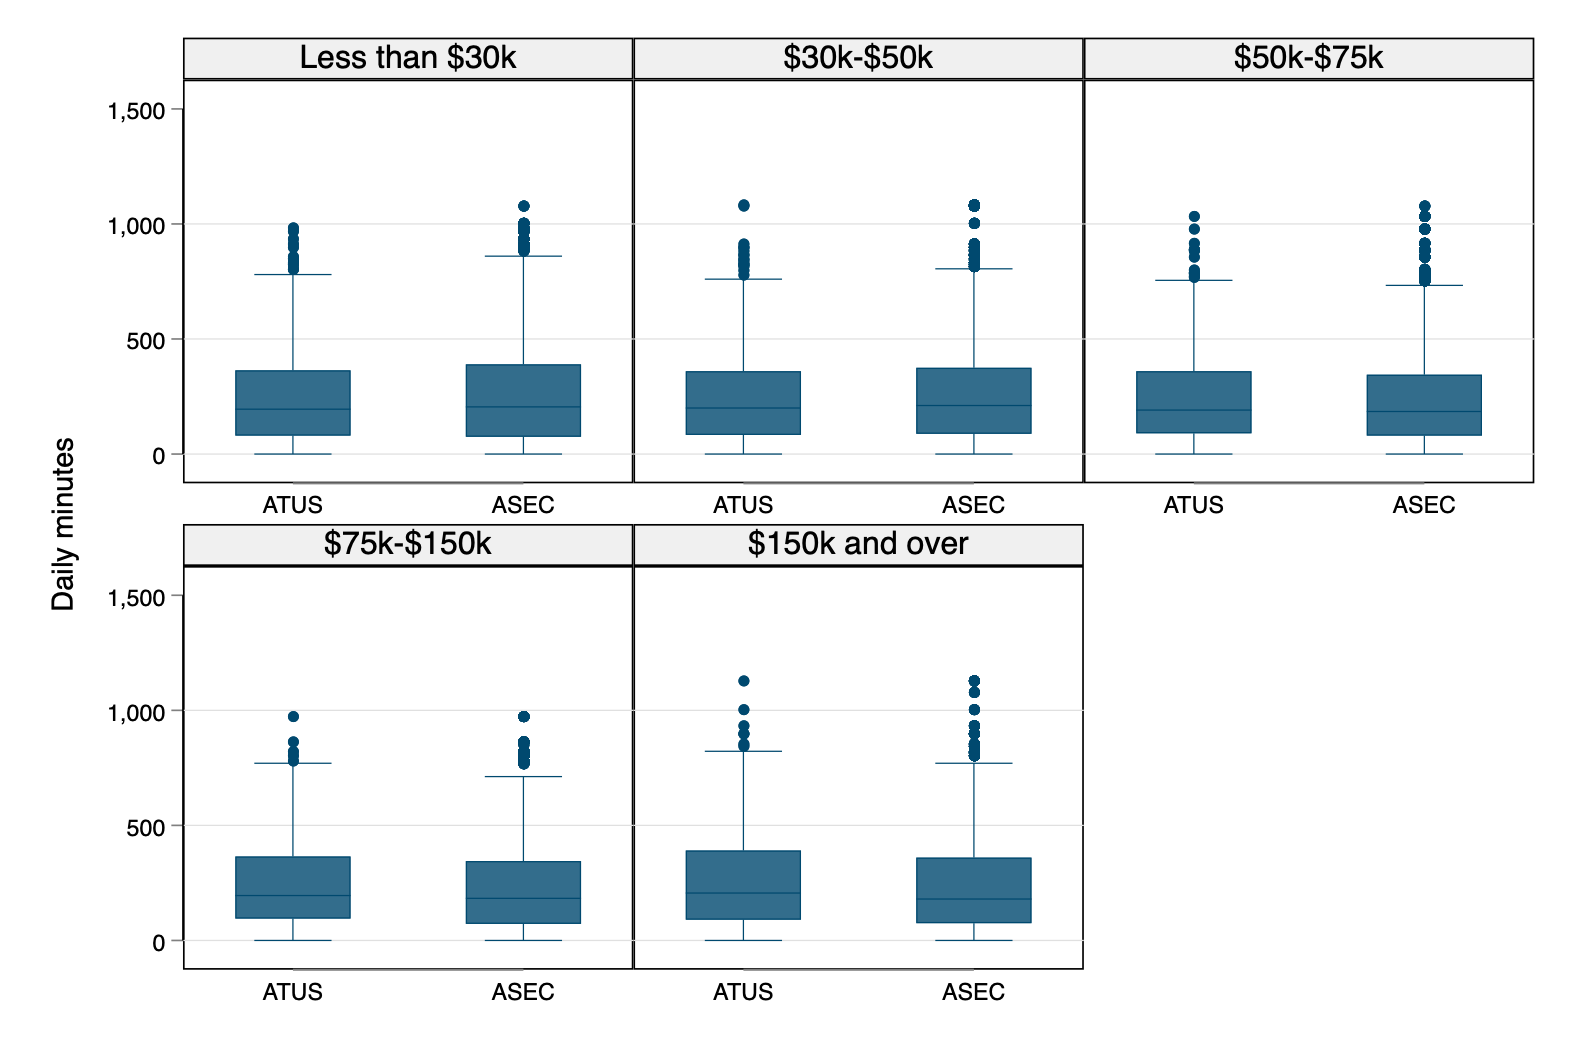
Family Income
Weekend


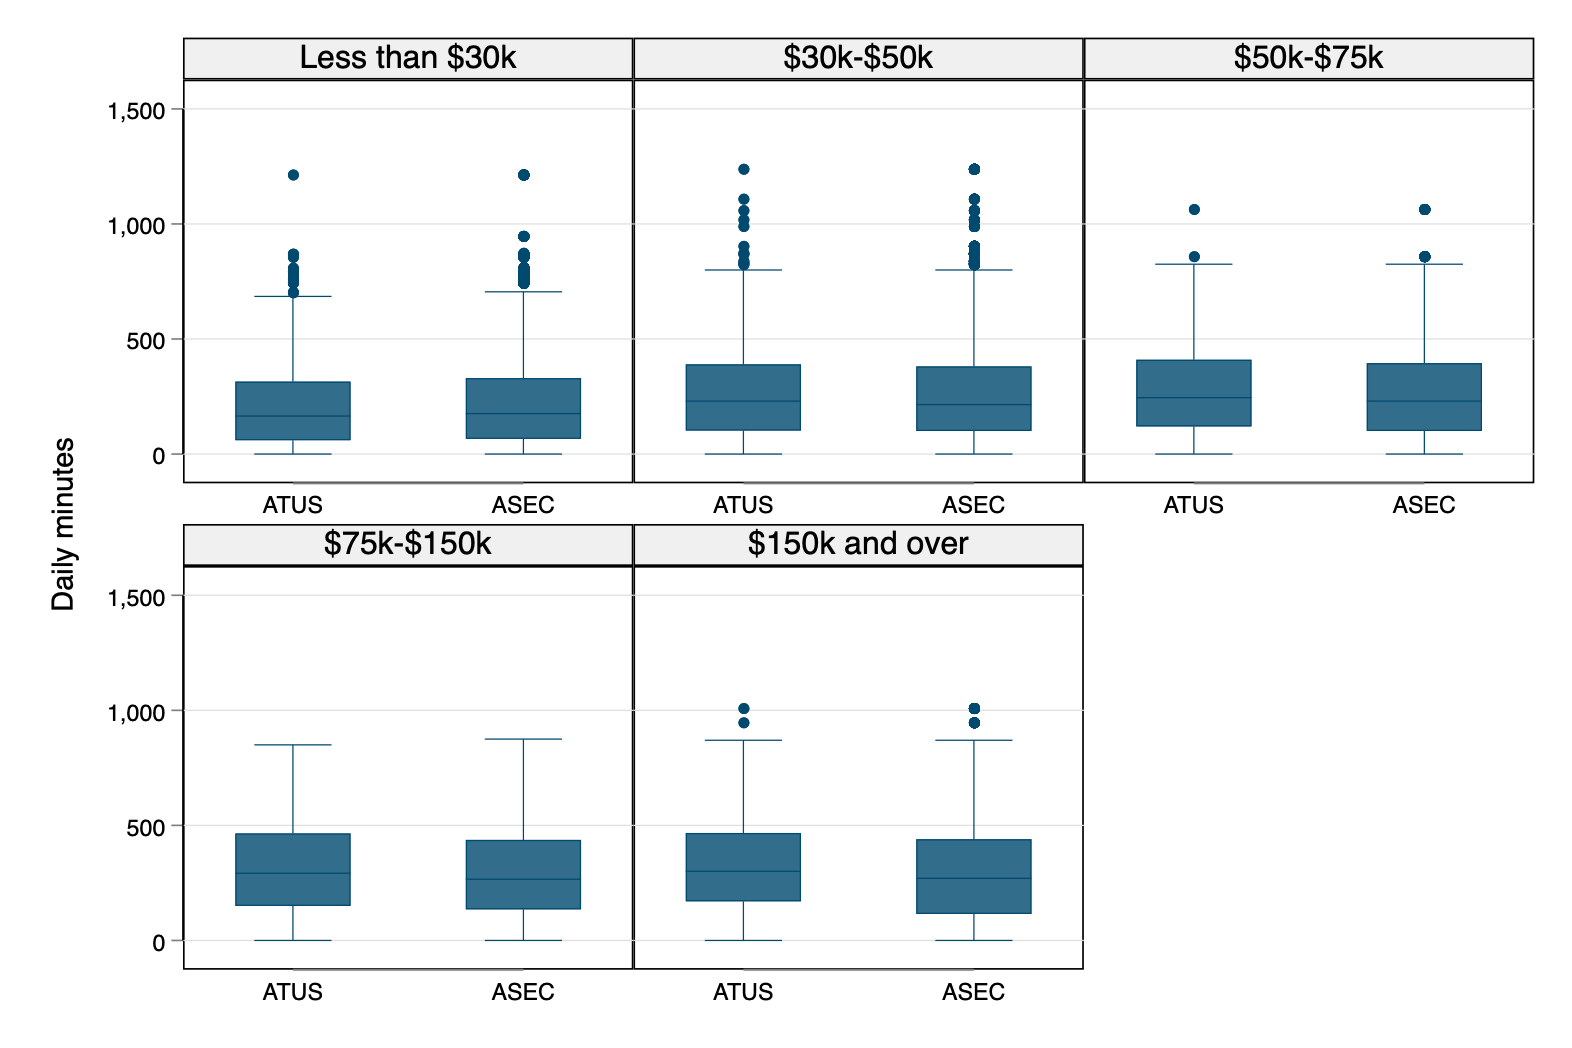
Weekday